Stock Market Trading Considerations For September 27, 2017
The S&P 500 (INDEXSP:.INX) is rallying on Wednesday morning ahead of comments from Janet Yellen and President Trump’s Tax speech. We are currently testing an important overhead resistance level on the S&P 500 futures. See key trading levels below.
Check out today’s economic calendar with a full rundown of releases. And note that the charts below are from our premium service and shared exclusively with See It Market readers.
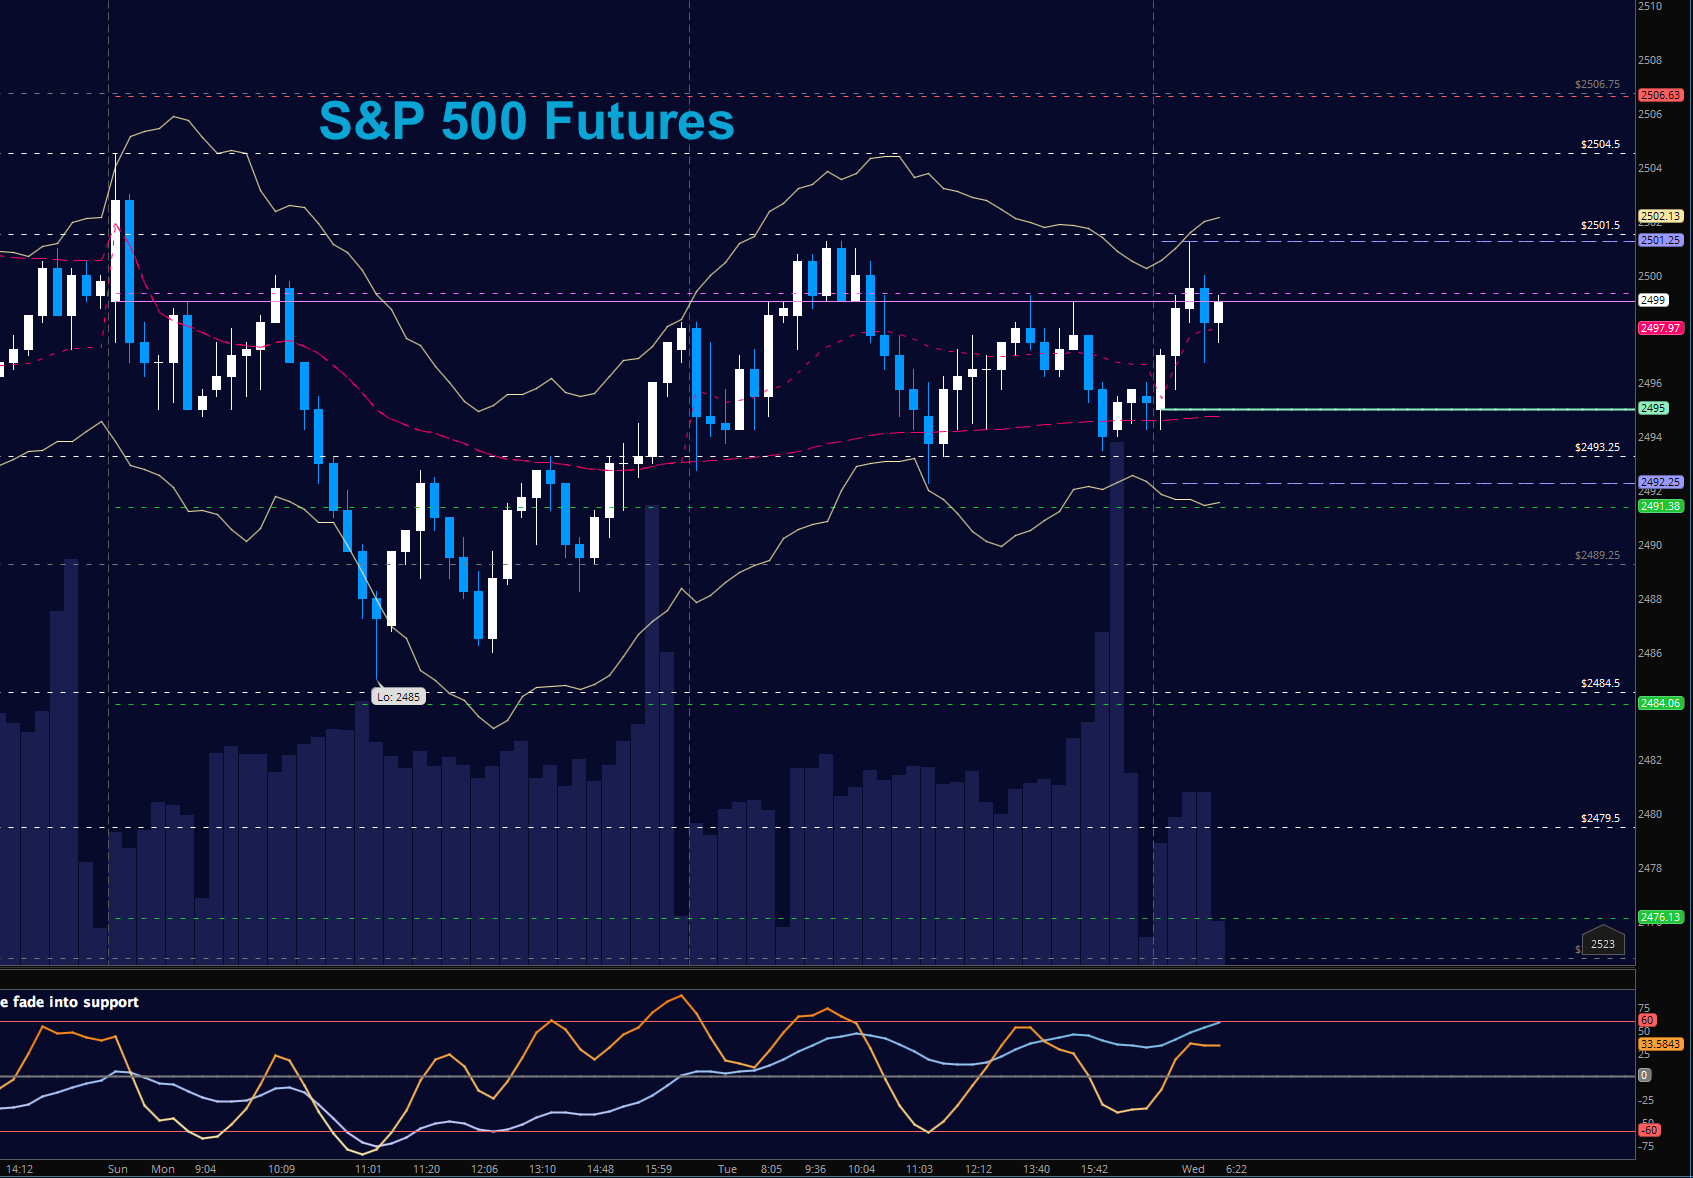
S&P 500 Futures (ES)
Congested behavior at first price resistance near 2501. Support held higher yesterday so holding 2492 will be key. The bullets below represent the likely shift of trading momentum at the positive or failed retests at the levels noted.
- Buying pressure intraday will likely strengthen above a positive retest of 2501.5 (but only into resistance)
- Selling pressure intraday will likely strengthen with a failed retest of 2492
- Resistance sits near 2499.75 to 2503.5, with 2506.5 and 2511.5 above that.
- Support holds between 2492 and 2487.5, with 2484.5 and 2479.5 below that.
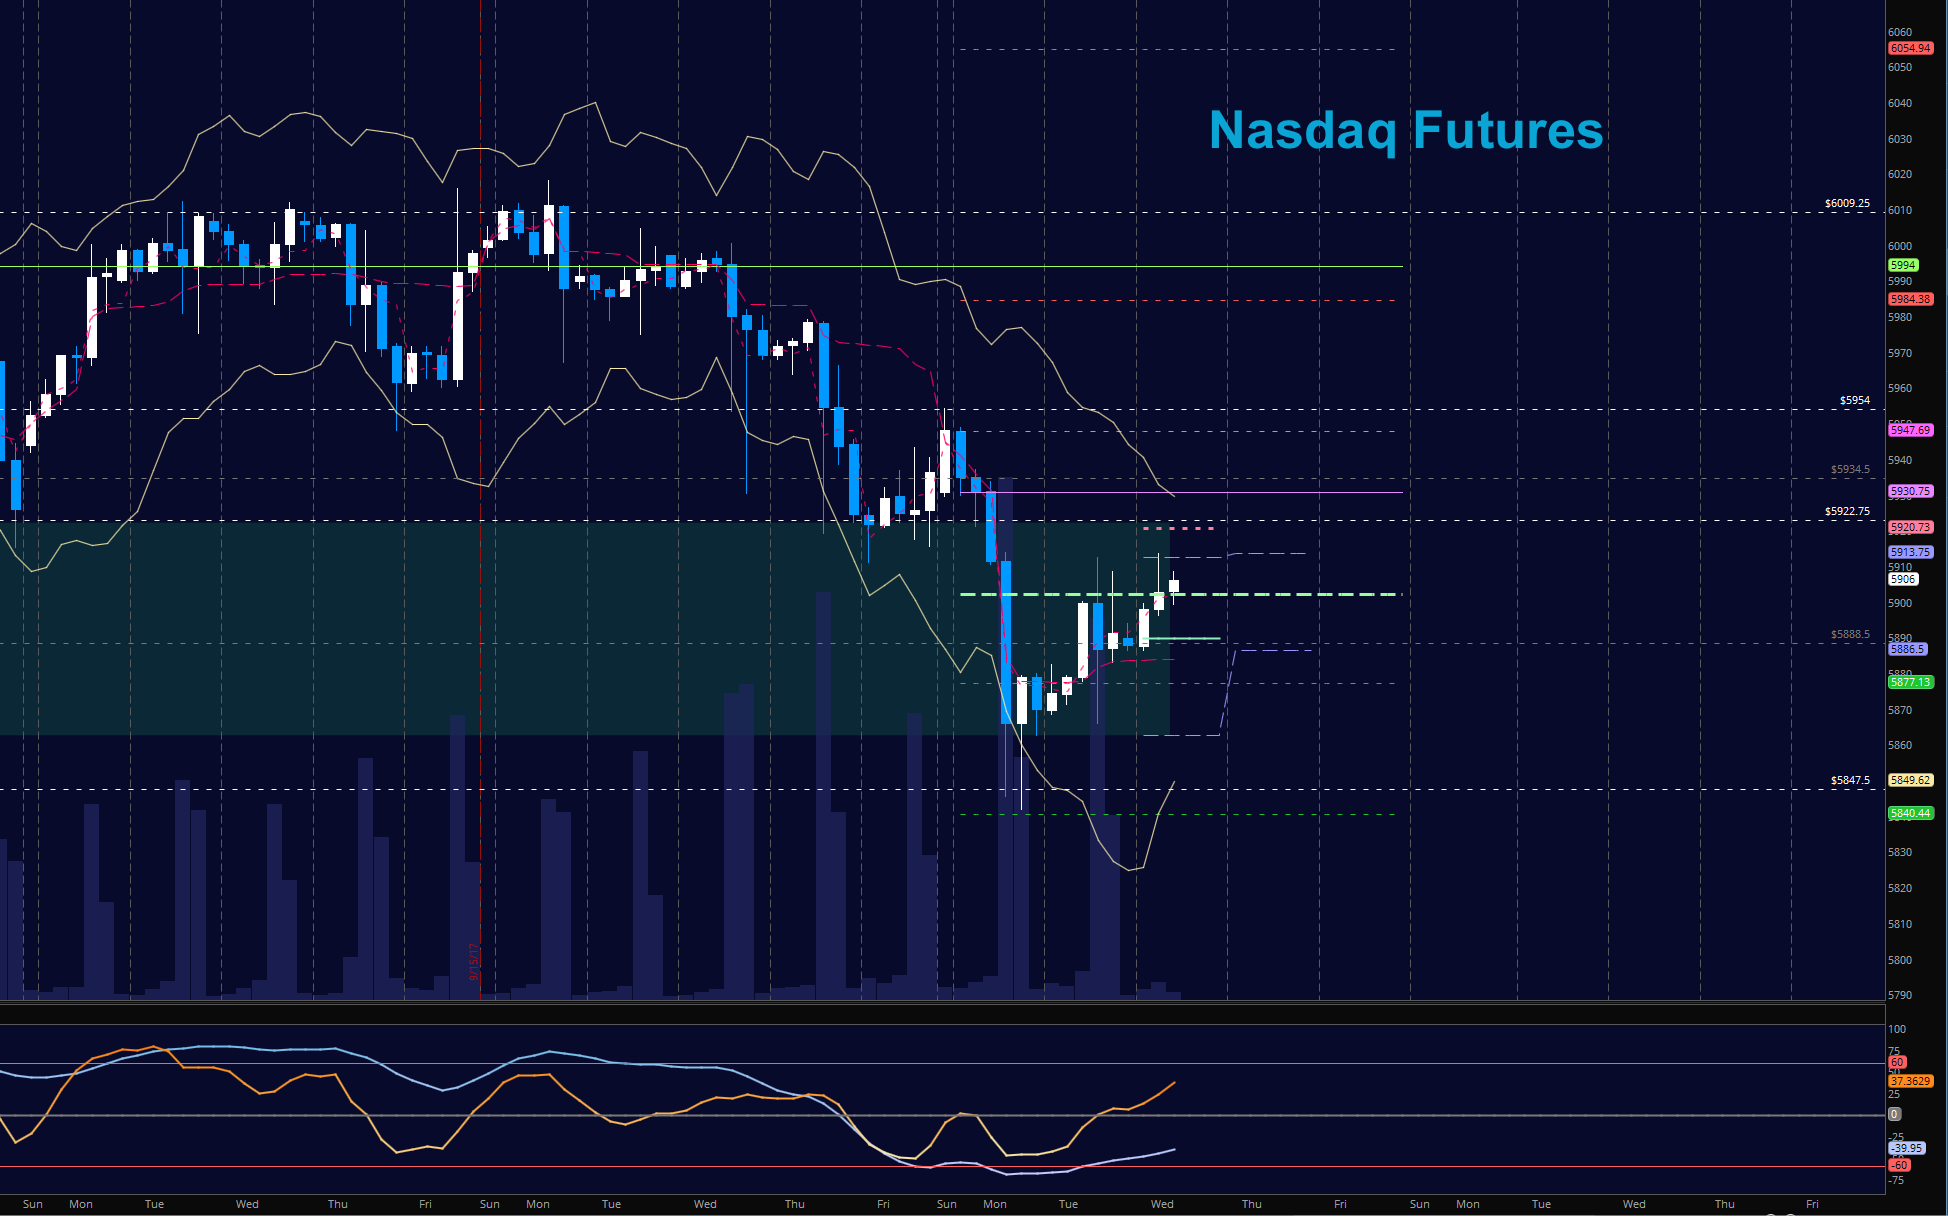
NASDAQ Futures (NQ)
Momentum still shows negative continuation so bounces are likely to fail near resistance. Buyers need to hold 5934 to assume any measure of control here. The bullets below represent the likely shift of intraday trading momentum at the positive or failed tests at the levels noted.
- Buying pressure intraday will likely strengthen with a positive retest of 5930.75 (but only into resistance)
- Selling pressure intraday will likely strengthen with a failed retest of 5877
- Resistance sits near 5913 to 5922.75, with 5930.75 and 5957.5 above that.
- Support holds between 5862.5 and 5854.5, with 5844.25 and 5774.5 below that.
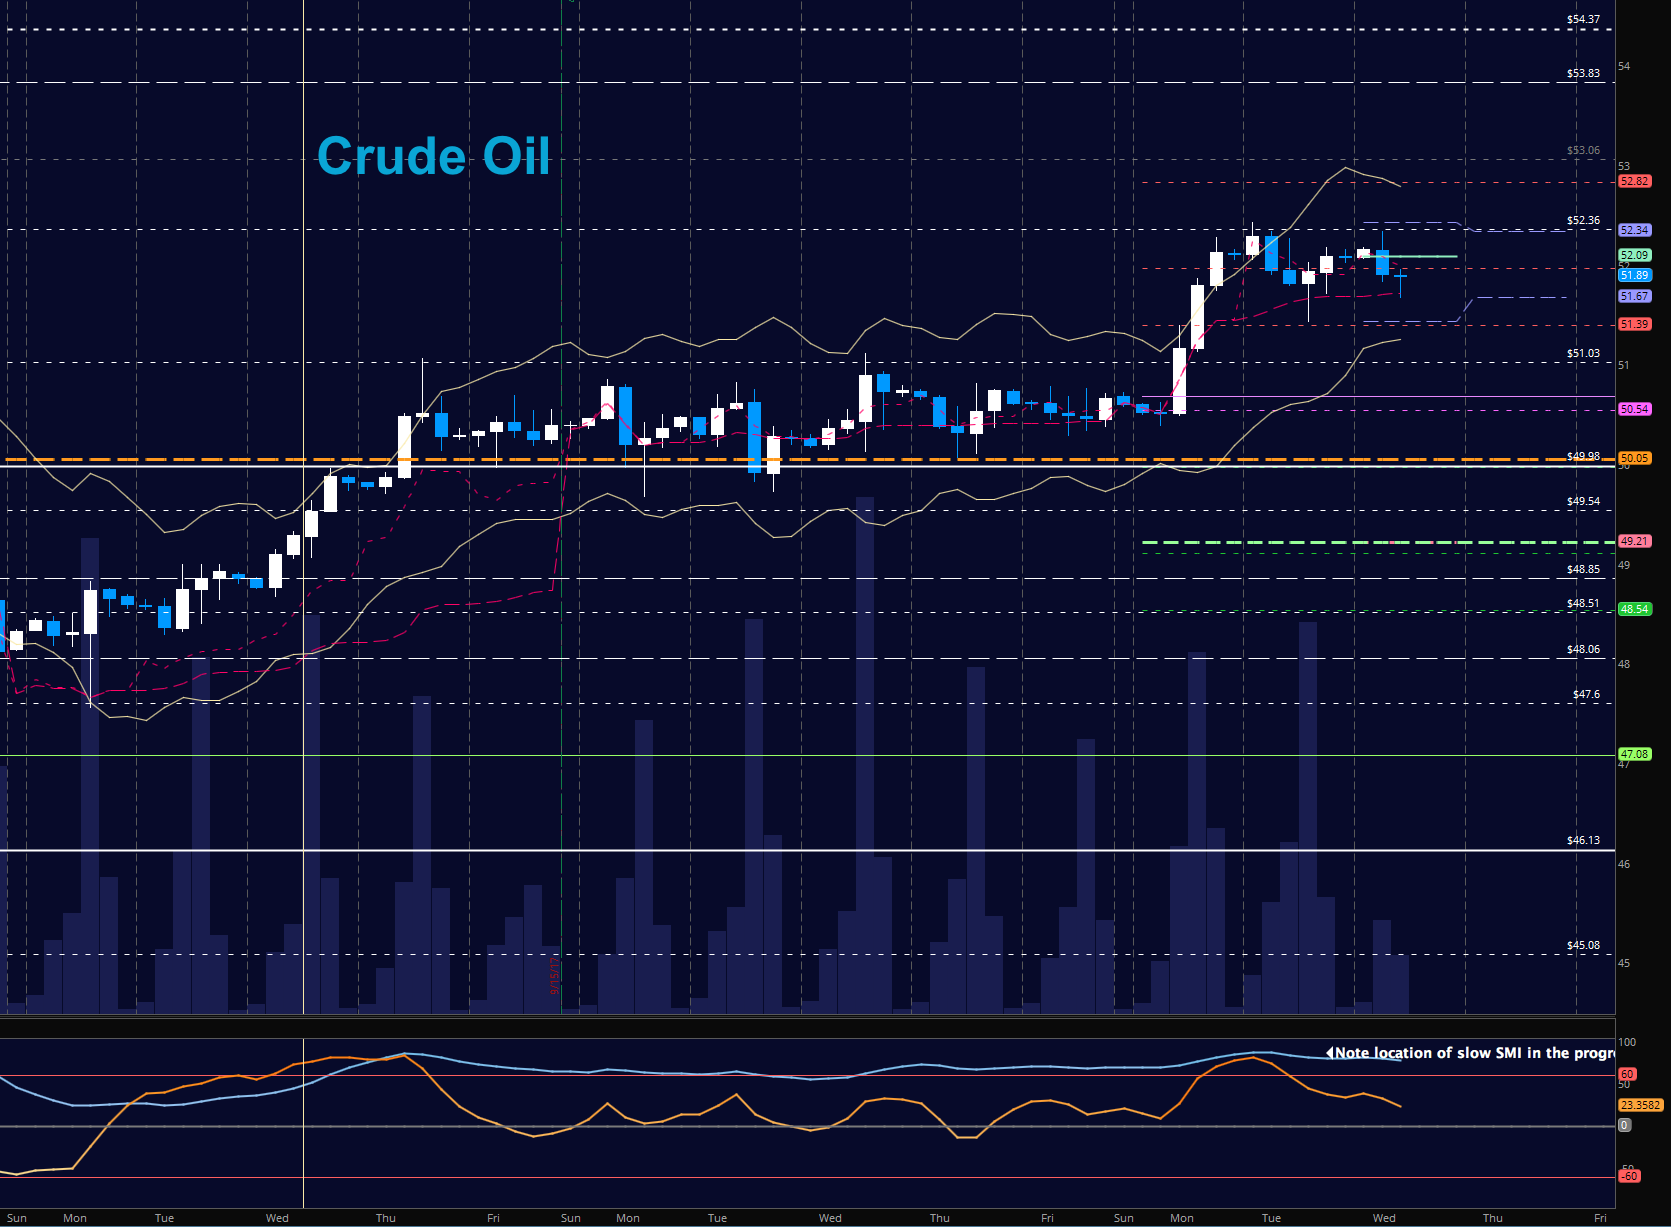
WTI Crude Oil
EIA report today. Buyers expand price right into the measure move of 52.32 once again and stalled after testing those regions (note the Fibonacci). Buyers are in clear control near 51.90, so pullbacks that hold this level will be buying zones. The bullets below represent the likely shift of trading momentum at the positive or failed tests at the levels noted.
- Buying pressure intraday will likely strengthen with a positive retest of 52.47
- Selling pressure intraday will strengthen with a failed retest of 51.5
- Resistance sits near 52.34 to 52.65, with 52.85 and 53.15 above that.
- Support holds between 51.67 to 51.39, with 51.1 and 50.68 below that.
If you’re interested in watching these trades go live, join us in the live trading room from 9am to 11:30am each trading day. Visit TheTradingBook for more information.
If you’re interested in the live trading room, it is now primarily stock market futures content, though we do track heavily traded stocks and their likely daily trajectories as well – we begin at 9am with a morning report and likely chart movements along with trade setups for the day.
As long as the trader keeps himself aware of support and resistance levels, risk can be very adequately managed to play in either direction as bottom picking remains a behavior pattern that is developing with value buyers and speculative traders.
Twitter: @AnneMarieTrades
The author trades stock market futures every day and may have a position in mentioned securities at the time of publication. Any opinions expressed herein are solely those of the author, and do not in any way represent the views or opinions of any other person or entity.

 Testing Important Price Support")
: Cup (and Maybe Handle) Watch")

