Stock Market Trading Considerations For October 17, 2017
The S&P 500 (INDEXSP:.INX) continues to grind higher in morning trade. Will this consolidation break higher once more… or roll over? Pay attention to key price pivots (support and resistance) for today (below).
Check out today’s economic calendar with a full rundown of releases. And note that the charts below are from our premium service and shared exclusively with See It Market readers.
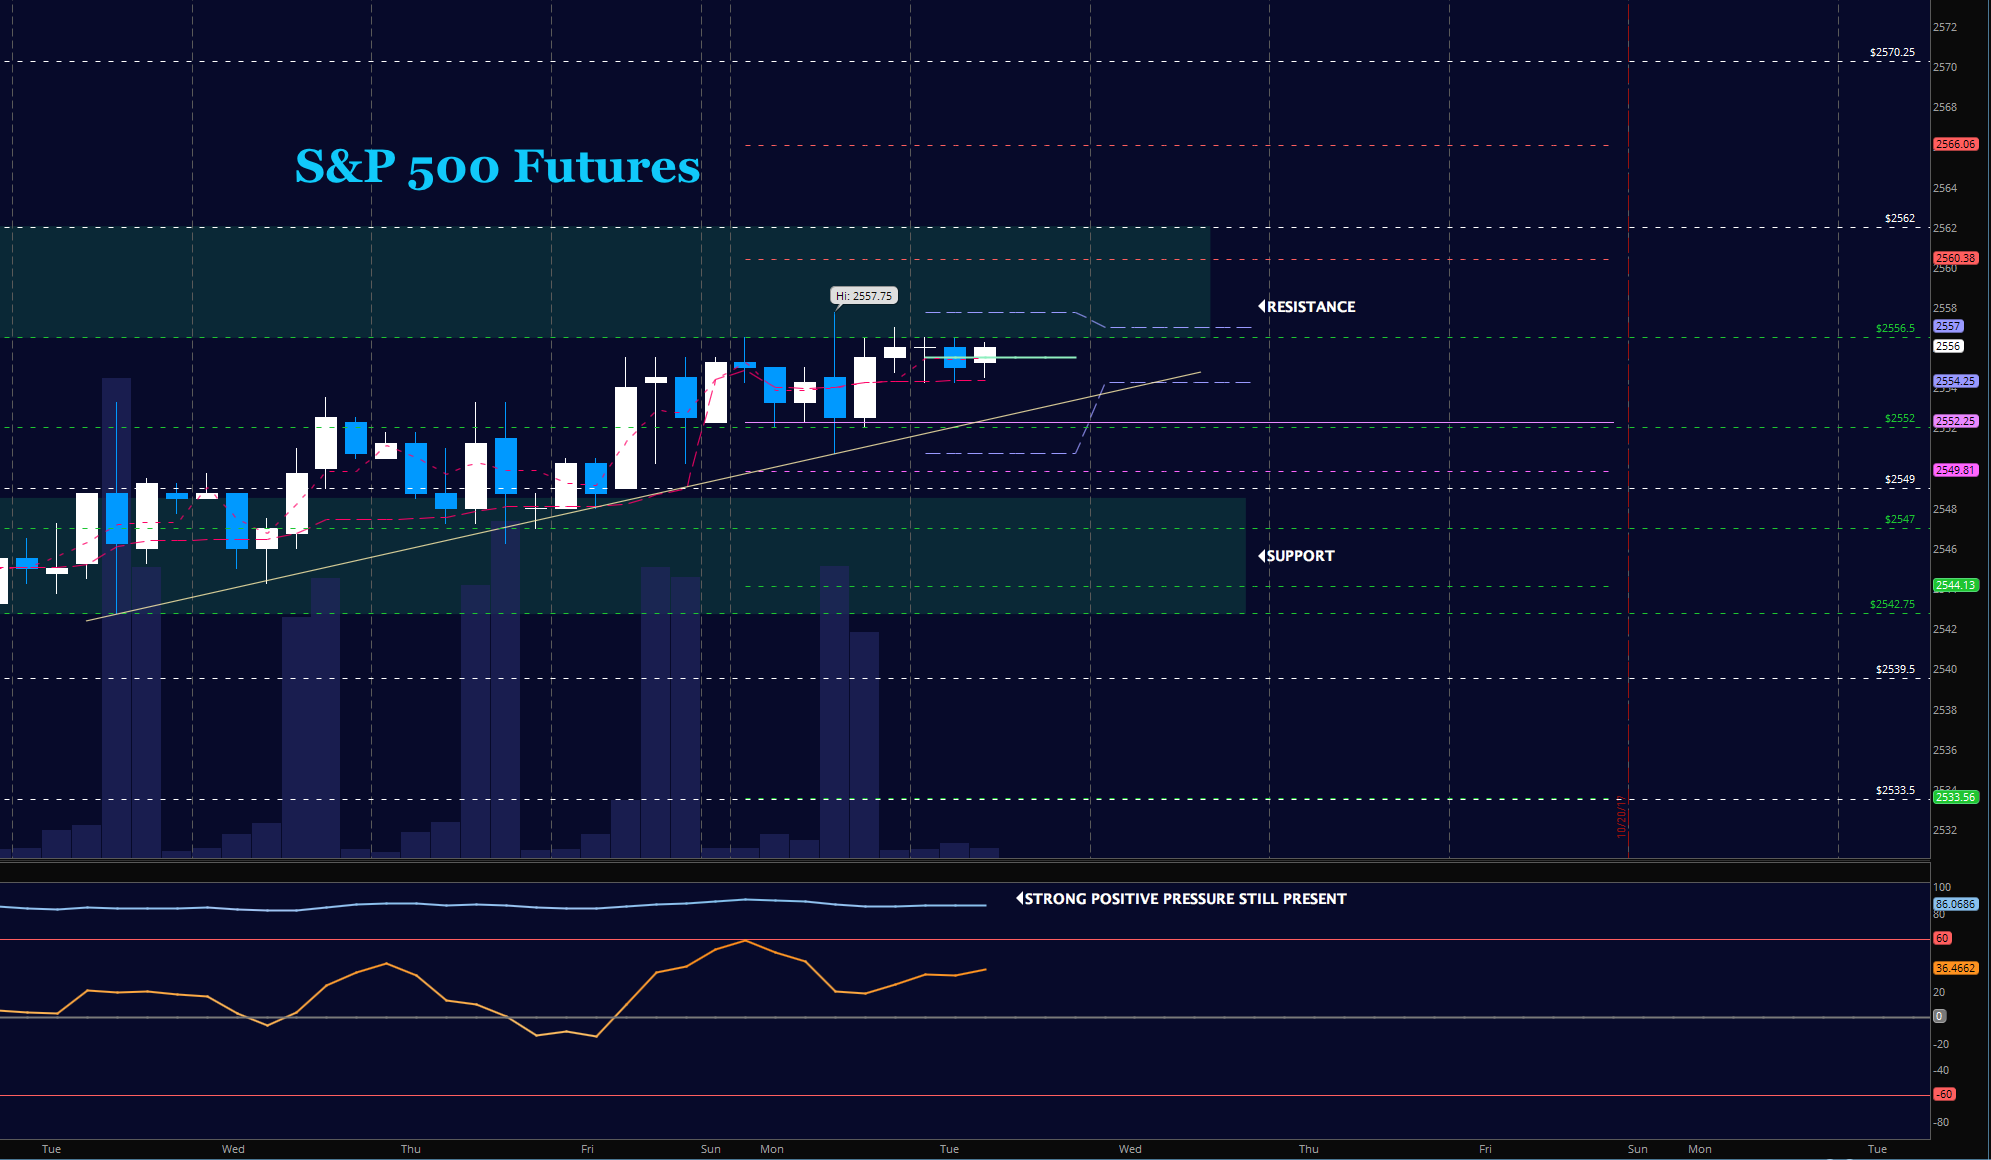
S&P 500 Futures (ES)
After another new high, charts have chopped around in congestion but holding higher lows. More grinding upside on the horizon, unless we lose 2542 and fail to quickly recapture it. Traders continue to buy pullbacks in the current formation but lower volumes here suggest some measure of caution with size. The bullets below represent the likely shift of trading momentum at the positive or failed retests at the levels noted.
- Buying pressure intraday will likely strengthen above a positive retest of 2556.5
- Selling pressure intraday will likely strengthen with a failed retest of 2547
- Resistance sits near 2556.5 to 2558.5, with 2560.5 and 2562.25 above that.
- Support holds between 2552 and 2547.5, with 2542.75 and 2539.75 below that.
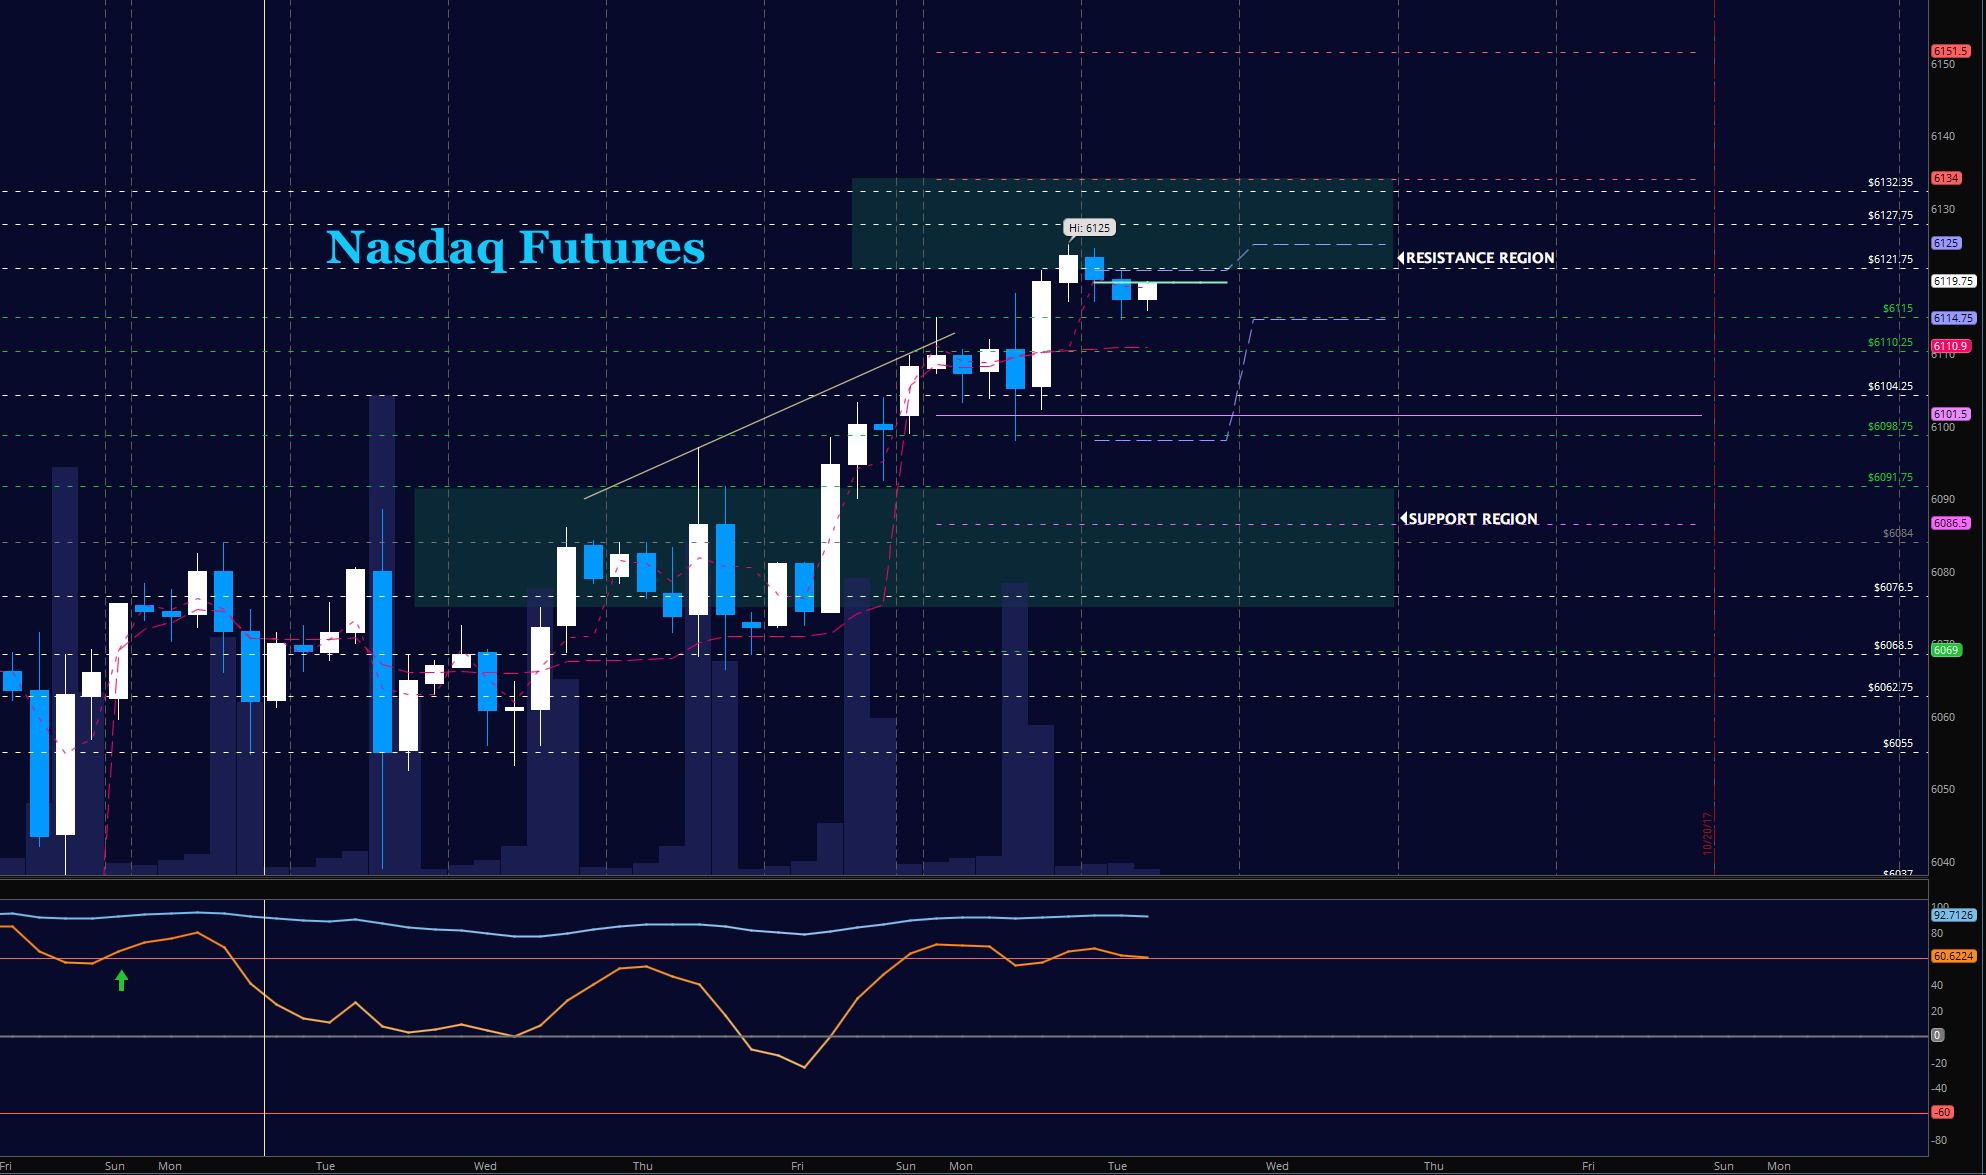
NASDAQ Futures (NQ)
Bullish formations continue here with higher lows presenting well as volume remains fairly steady – though also slightly lower. Holding 6104 will be key for buyers to maintain today as the big range expansion from yesterday is likely to retrace in some measure. The bullets below represent the likely shift of intraday trading momentum at the positive or failed tests at the levels noted.
- Buying pressure intraday will likely strengthen with a positive retest of 6121.5
- Selling pressure intraday will likely strengthen with a failed retest of 6104.5
- Resistance sits near 6121.25 to 6127.25 with 6132.75.25 and 6137.75 above that.
- Support holds between 6110.75 and 6104.5, with 6098.25 and 6084.75 below that.
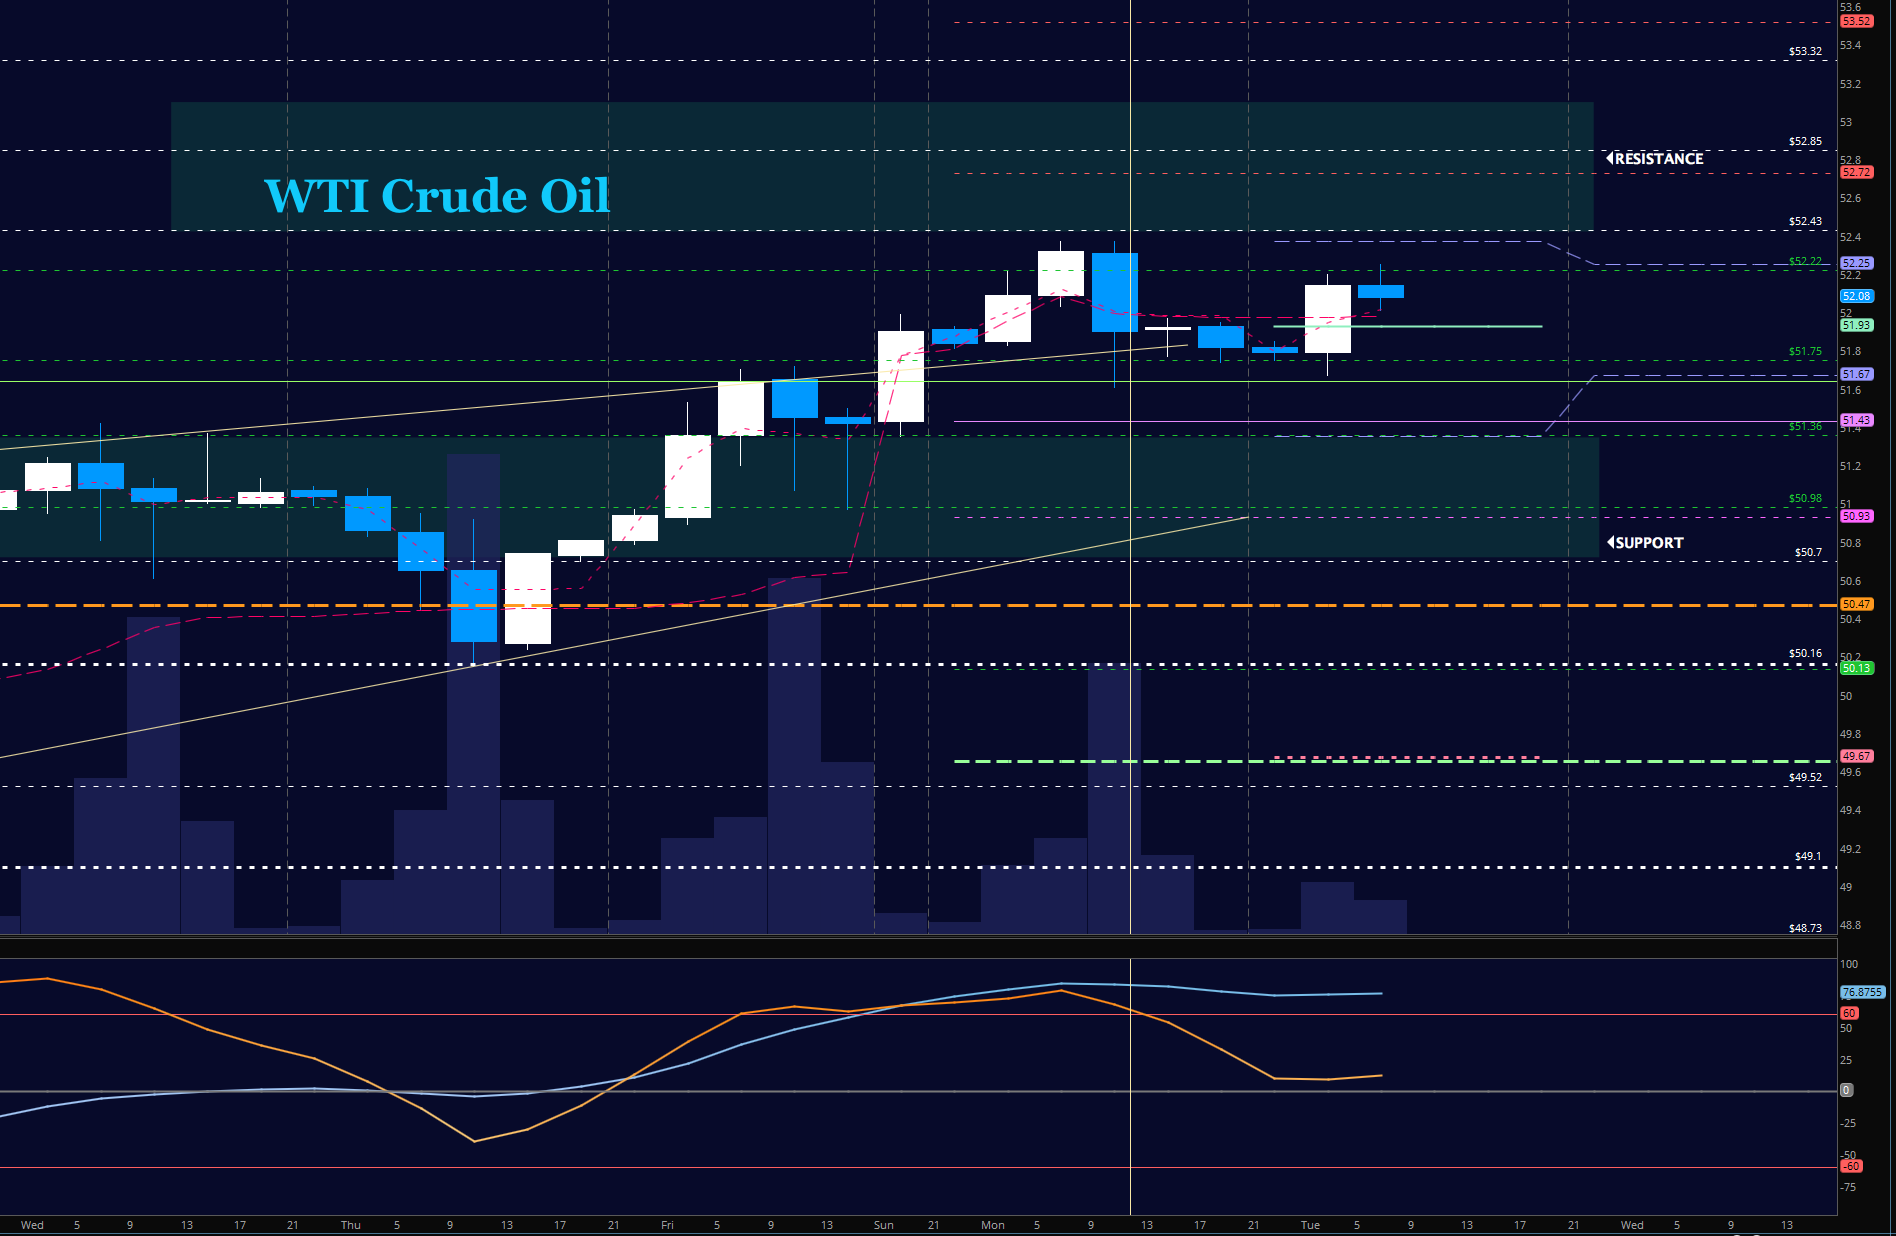
WTI Crude Oil
Oil traders continue to push prices upward testing near 52.20, for the second day in a row. Formations currently suggest that pullbacks will find still find higher support as the targets around 53.3 begin to come into focus. The bullets below represent the likely shift of trading momentum at the positive or failed tests at the levels noted.
- Buying pressure intraday will likely strengthen with a positive retest of 52.27
- Selling pressure intraday will strengthen with a failed retest of 51.36
- Resistance sits near 52.25 to 52.43, with 52.84 and 53.38 above that
- Support holds between 51.75 to 51.36, with 50.84 and 50.16 below that
If you’re interested in the live trading room, it is now primarily stock market futures content, though we do track heavily traded stocks and their likely daily trajectories as well – we begin at 9am with a morning report and likely chart movements along with trade setups for the day.
As long as the trader keeps himself aware of support and resistance levels, risk can be very adequately managed to play in either direction as bottom picking remains a behavior pattern that is developing with value buyers and speculative traders.
Twitter: @AnneMarieTrades
The author trades stock market futures every day and may have a position in mentioned securities at the time of publication. Any opinions expressed herein are solely those of the author, and do not in any way represent the views or opinions of any other person or entity.


