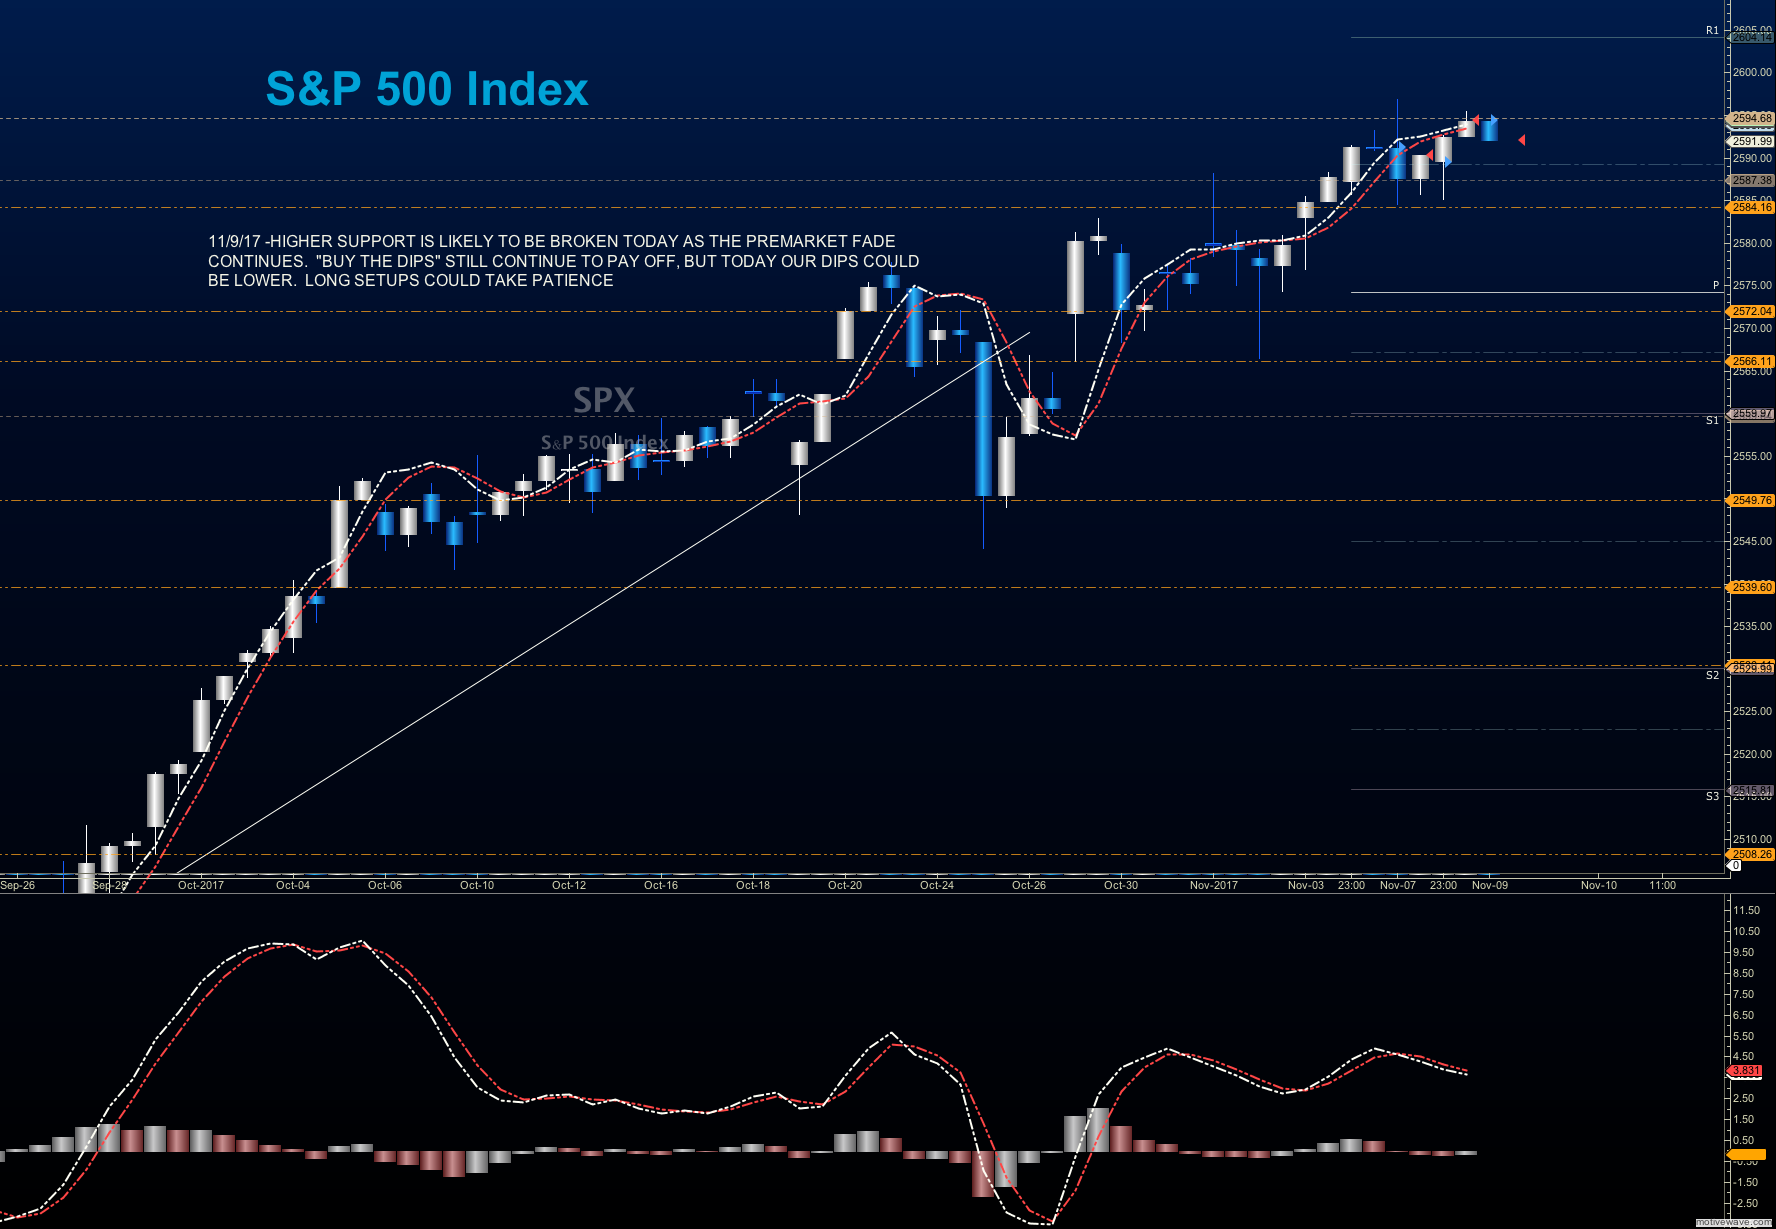
S&P 500 Index Chart – November 9
Stock Market Futures Trading Considerations For November 9, 2017
The S&P 500 (INDEXSP:.INX) is trading lower on Thursday morning, as a pullback has commenced. Lower support levels will be important to watch today, along with bounce attempts (and how they behave at resistance). Key trading levels and futures market commentary can be found below.
Check out today’s economic calendar with a full rundown of releases.
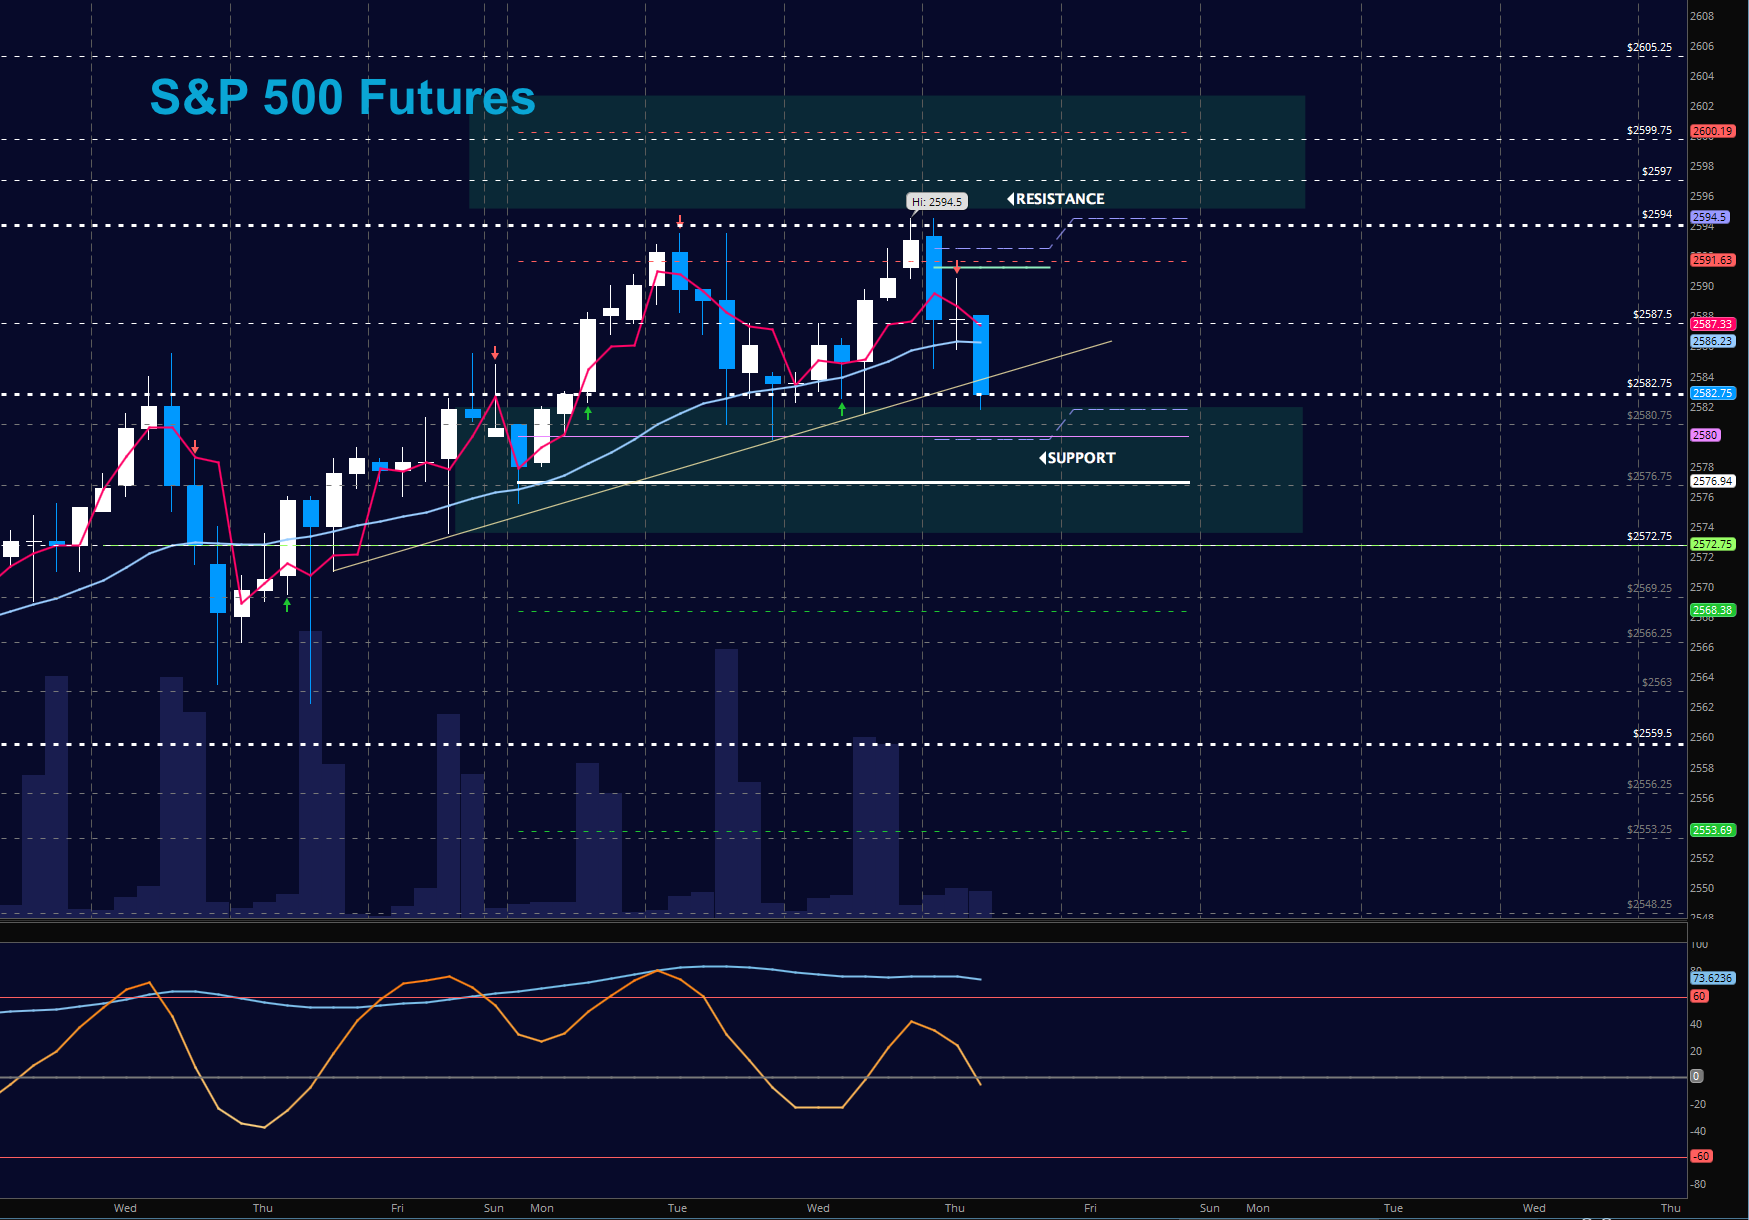
S&P 500 Futures
Charts are fading in a test of lower support zones in our bullish formation after NEW HIGHS yesterday. The greatest opportunities still lie at the tests of deeper support – near yesterday’s low 2581 -for long entries. The failure to recapture 2586 is likely to telegraph a test of deeper support into 2576.5. The bullets below represent the likely shift of trading momentum at the positive or failed retests at the levels noted.
- Buying pressure intraday will likely strengthen above a positive retest of 2588.75
- Selling pressure intraday will likely strengthen with a failed retest of 2576.5
- Resistance sits near 2586.75 to 2591.5, with 2594.75 and 2600.5 above that.
- Support holds between 2581.5 and 2576.75, with 2574 and 2568.5 below that.
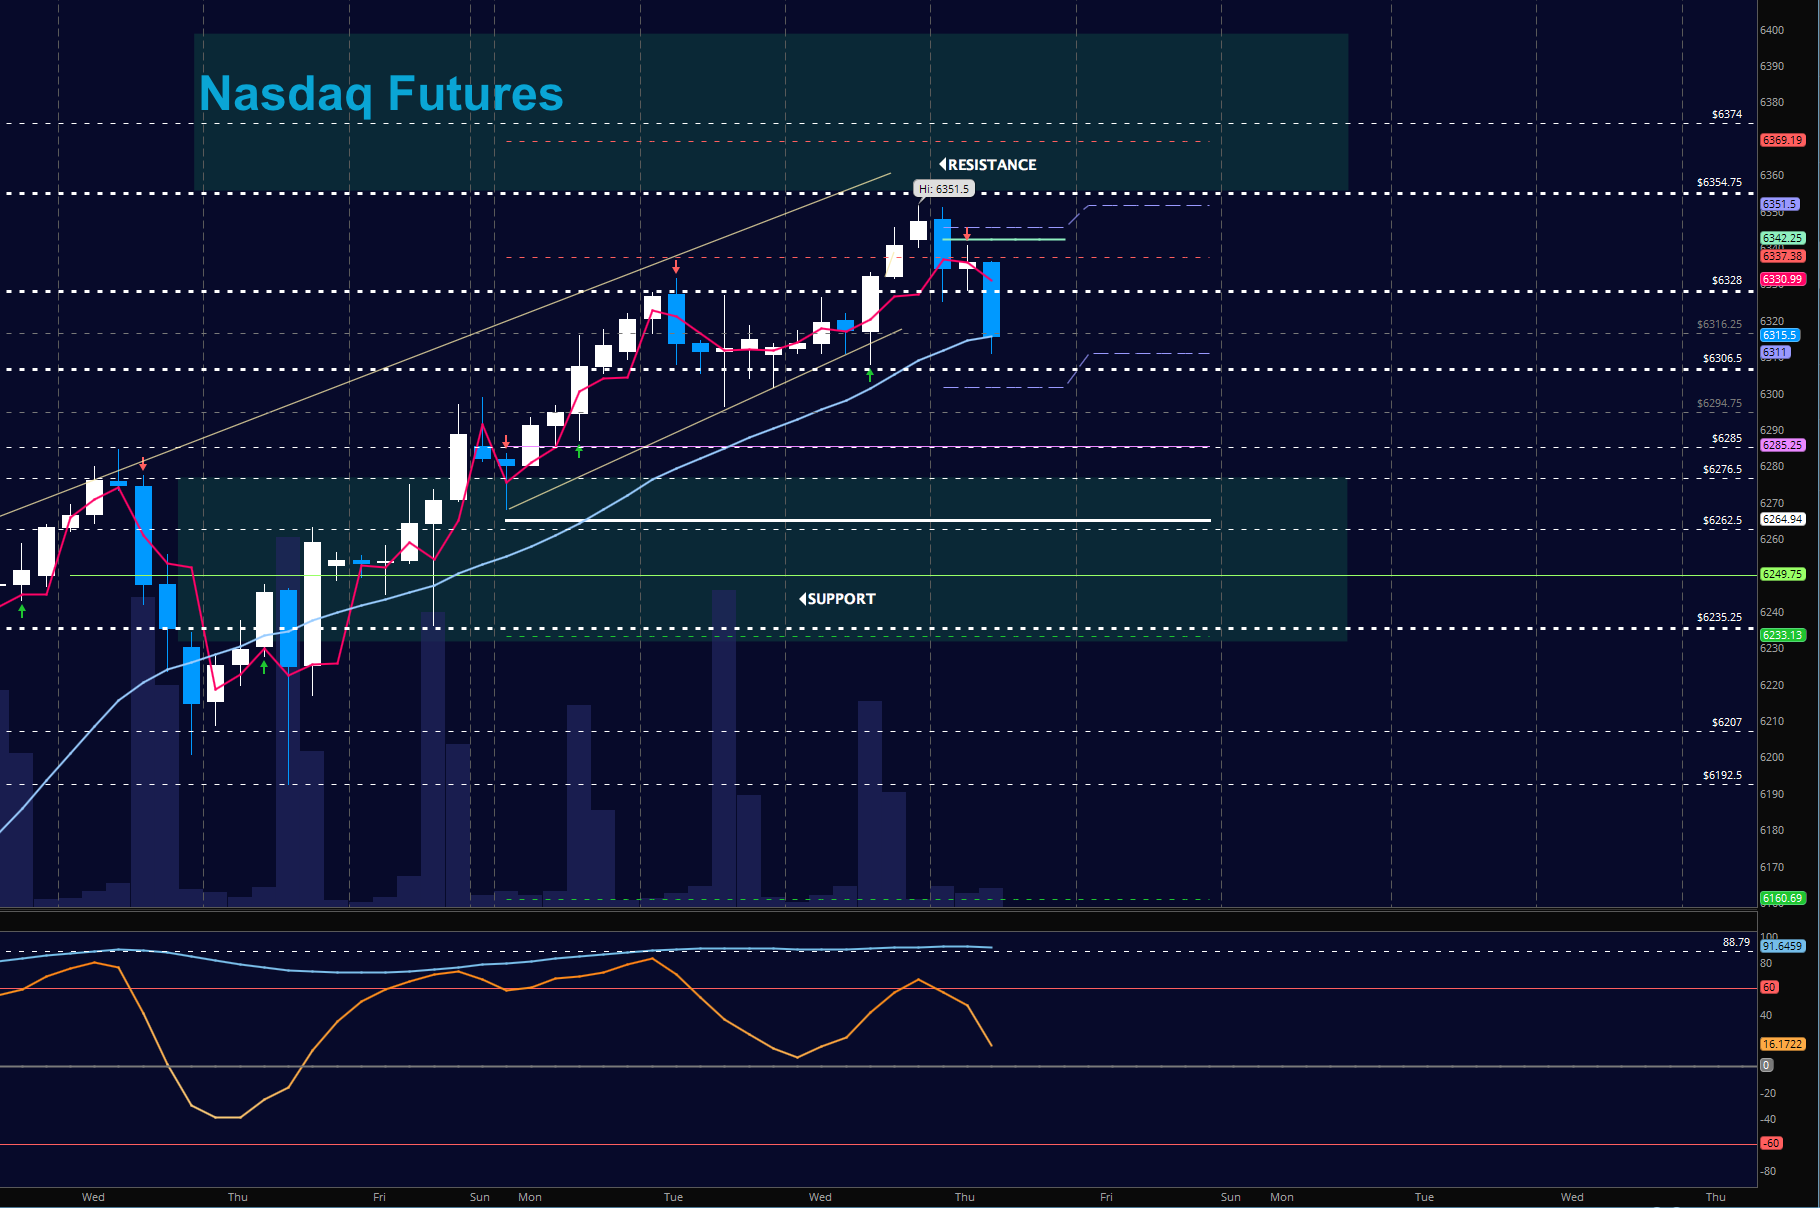
NASDAQ Futures
The NQ held HIGHER HIGHS and HIGHER LOWS but is now fading into yesterday’s low where we should find support if we are to find buyers there. As long as we hold 6305.75, buyers will continue to hold strong and bullish patterns continue. LOWER HIGHS seem likely today as long as we hold below 6331.25. The bullets below represent the likely shift of intraday trading momentum at the positive or failed tests at the levels noted.
- Buying pressure intraday will likely strengthen with a positive retest of 6331.25
- Selling pressure intraday will likely strengthen with a failed retest of 6303.5
- Resistance sits near 6327.75 to 6337.25 with 6351.5 and 6369.75 above that.
- Support holds between 6310.5 and 6305.5, with 6285.75 and 6264.5 below that.
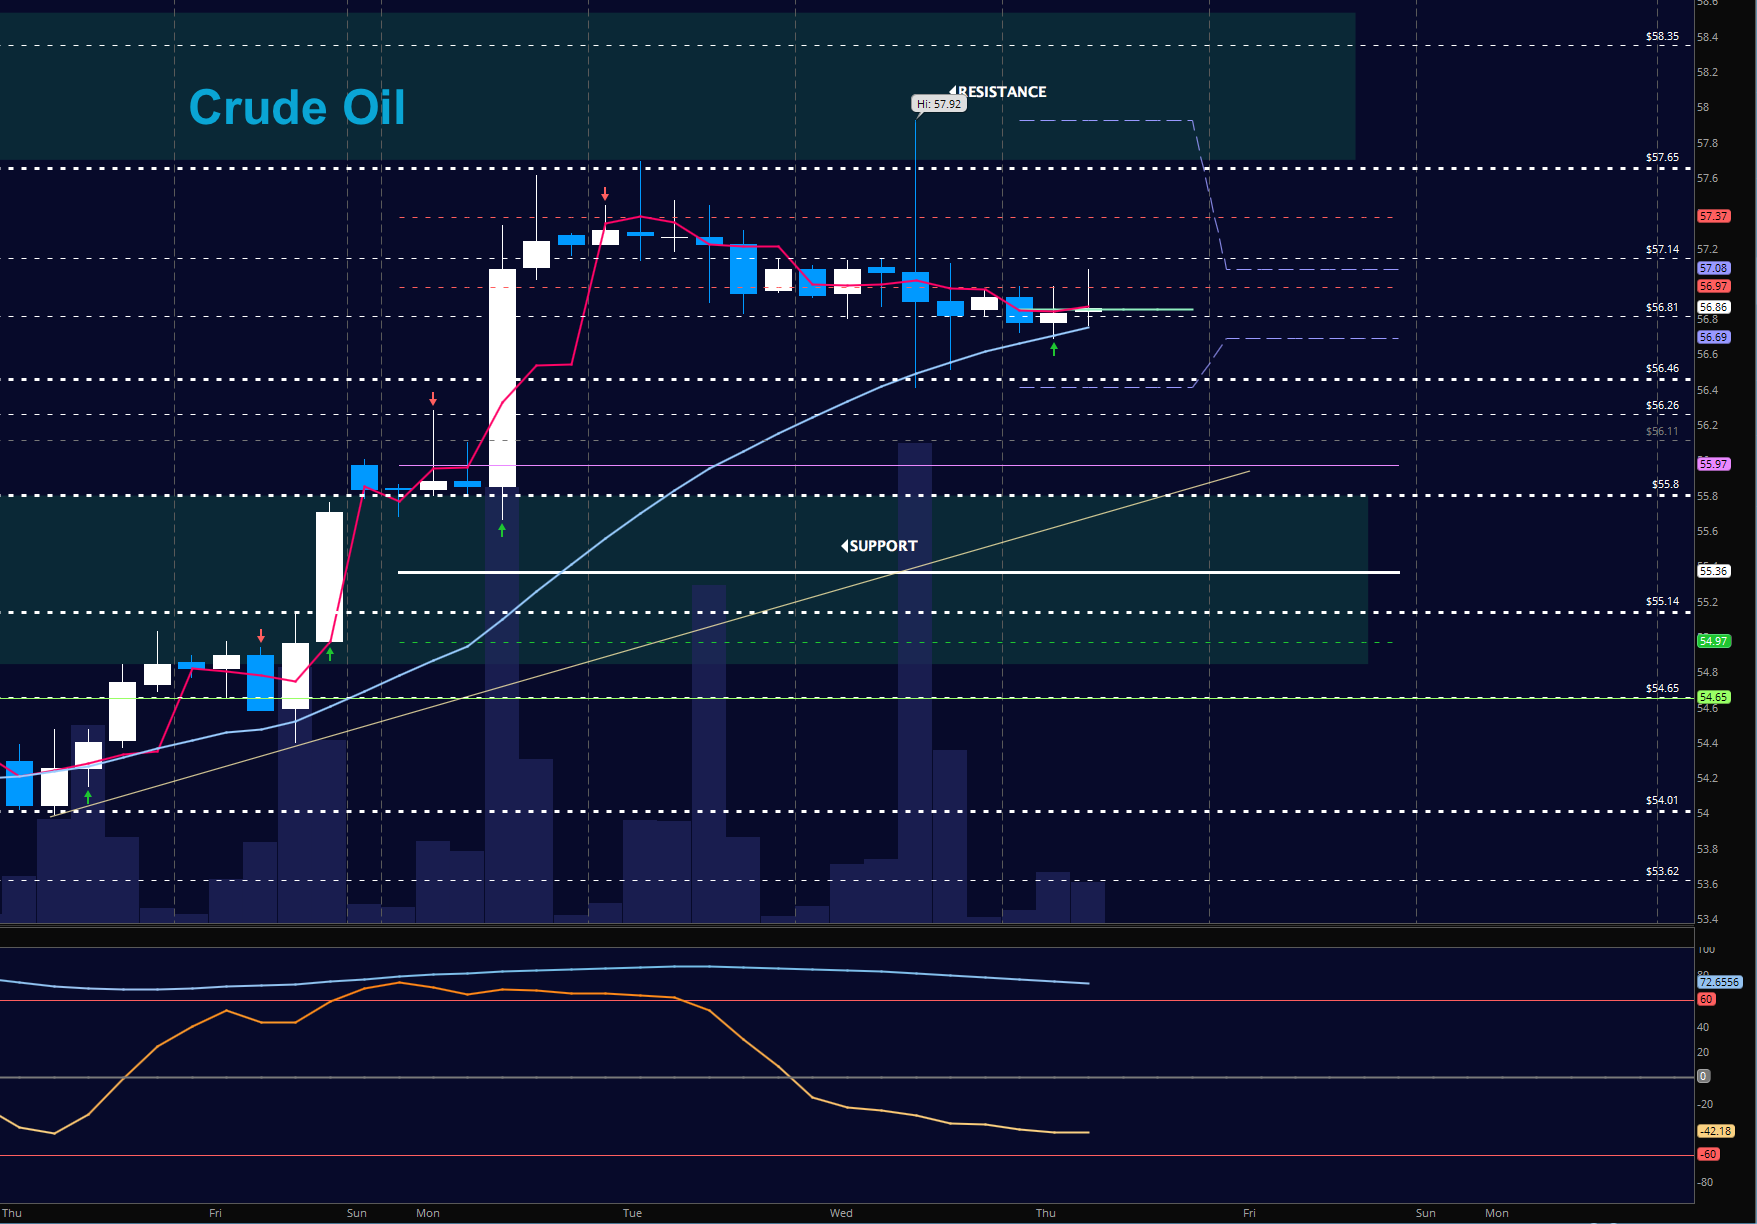
WTI Crude Oil
EIA yesterday showed a build. Traders spiked prices higher before heading lower to end the day range bound in familiar places. Pullbacks into support should still be key buy zones , though lower than yesterday – near 56.4. The bullets below represent the likely shift of trading momentum at the positive or failed tests at the levels noted.
- Buying pressure intraday will likely strengthen with a positive retest of 57.23
- Selling pressure intraday will strengthen with a failed retest of 56.69
- Resistance sits near 57.65 to 57.92, with 58.35 and 58.95 above that.
- Support holds between 56.8 to 56.3, with 55.9 and 55.36 below that.
If you’re interested in the live trading room, it is now primarily stock market futures content, though we do track heavily traded stocks and their likely daily trajectories as well – we begin at 9am with a morning report and likely chart movements along with trade setups for the day.
As long as the trader keeps himself aware of support and resistance levels, risk can be very adequately managed to play in either direction as bottom picking remains a behavior pattern that is developing with value buyers and speculative traders.
Twitter: @AnneMarieTrades
The author trades stock market futures every day and may have a position in mentioned securities at the time of publication. Any opinions expressed herein are solely those of the author, and do not in any way represent the views or opinions of any other person or entity.


: Showing Some Signs of Emerging Strength")
