Stock Market Futures Trading Considerations For November 6, 2017
The S&P 500 (INDEXSP:.INX) and Nasdaq (INDEXNASDAQ:.IXIC) are trading slightly higher on Monday morning as traders begin the new week. Important trading levels and futures market commentary can be found below.
Check out today’s economic calendar with a full rundown of releases.
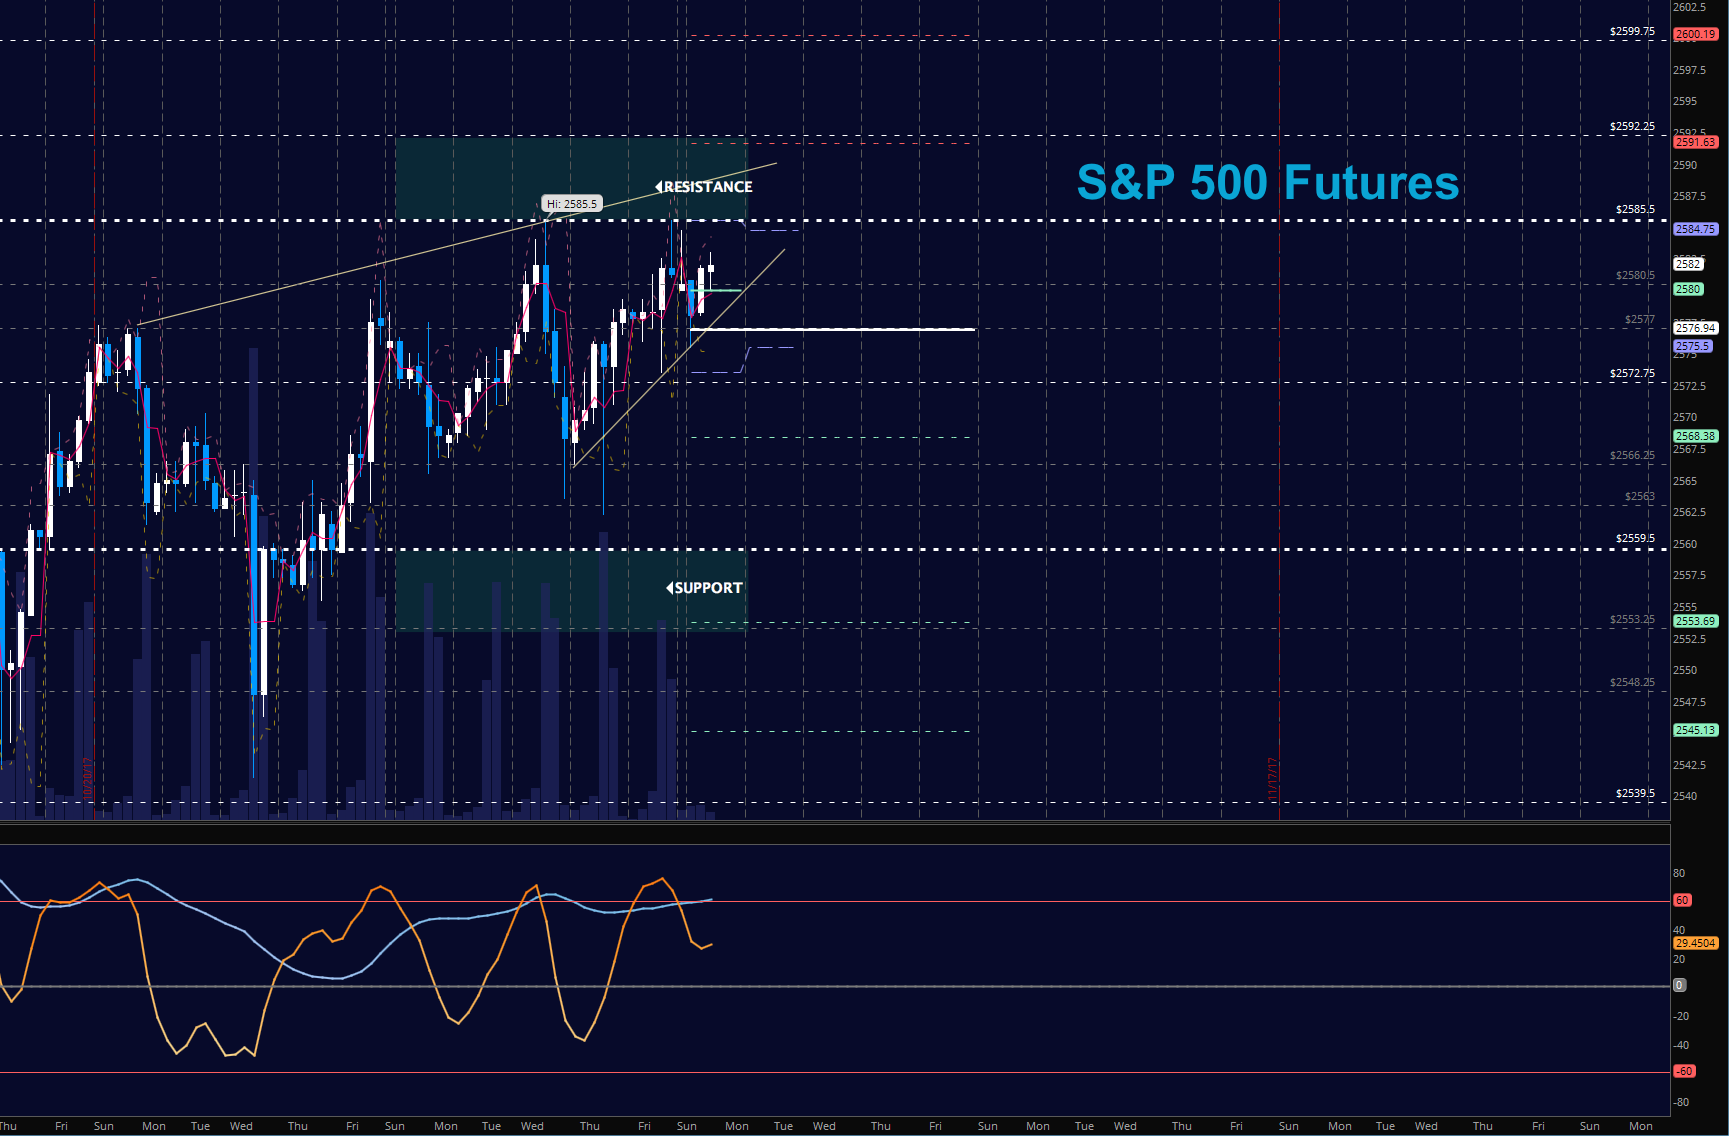
S&P 500 Futures
The RETEST of the PRIOR HIGH and subsequent HIGHER LOWS form the backdrop of today’s motion. Markets remain bullish with the greatest opportunities lying at the tests of support for long entries. Watch support regions to hold in the climb forward. The bullets below represent the likely shift of trading momentum at the positive or failed retests at the levels noted.
- Buying pressure intraday will likely strengthen above a positive retest of 2585.5
- Selling pressure intraday will likely strengthen with a failed retest of 2572.5
- Resistance sits near 2585.75 to 2592.5, with 2599.75 and 2614.5 above that.
- Support holds between 2573.5 and 2568.5, with 2562.5 and 2554.5 below that.
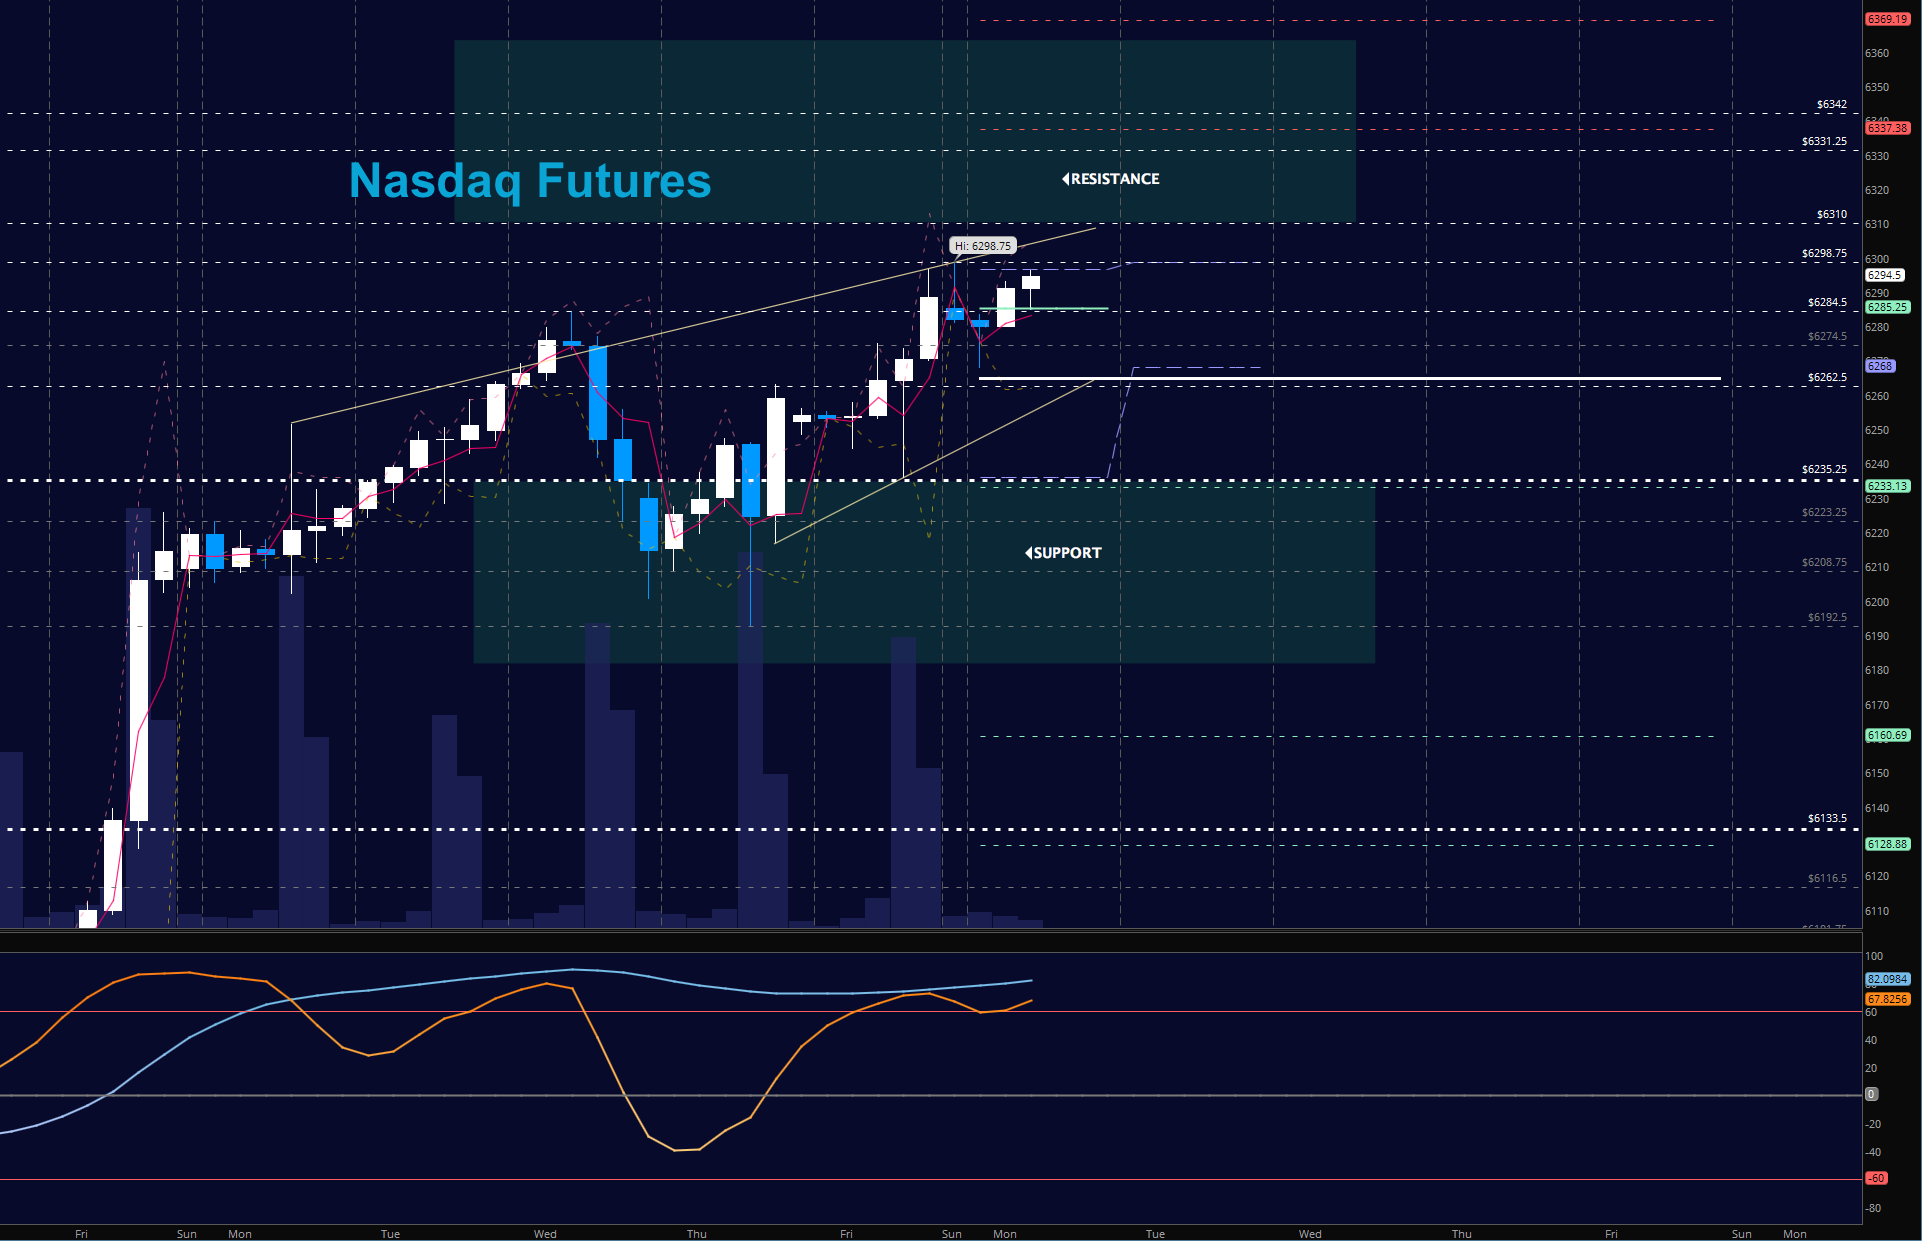
NASDAQ Futures
The NQ held HIGHER LOWS once more and tested NEW HIGHS overnight. As long as we hold 6256.75, buyers will continue to hold strong. The bullets below represent the likely shift of intraday trading momentum at the positive or failed tests at the levels noted.
- Buying pressure intraday will likely strengthen with a positive retest of 6295.75
- Selling pressure intraday will likely strengthen with a failed retest of 6262.5
- Resistance sits near 6295.75 to 6312.5 with 6322.25 and 6331.5 above that.
- Support holds between 6270.25 and 6262.5, with 6240.75 and 6236.5 below that.
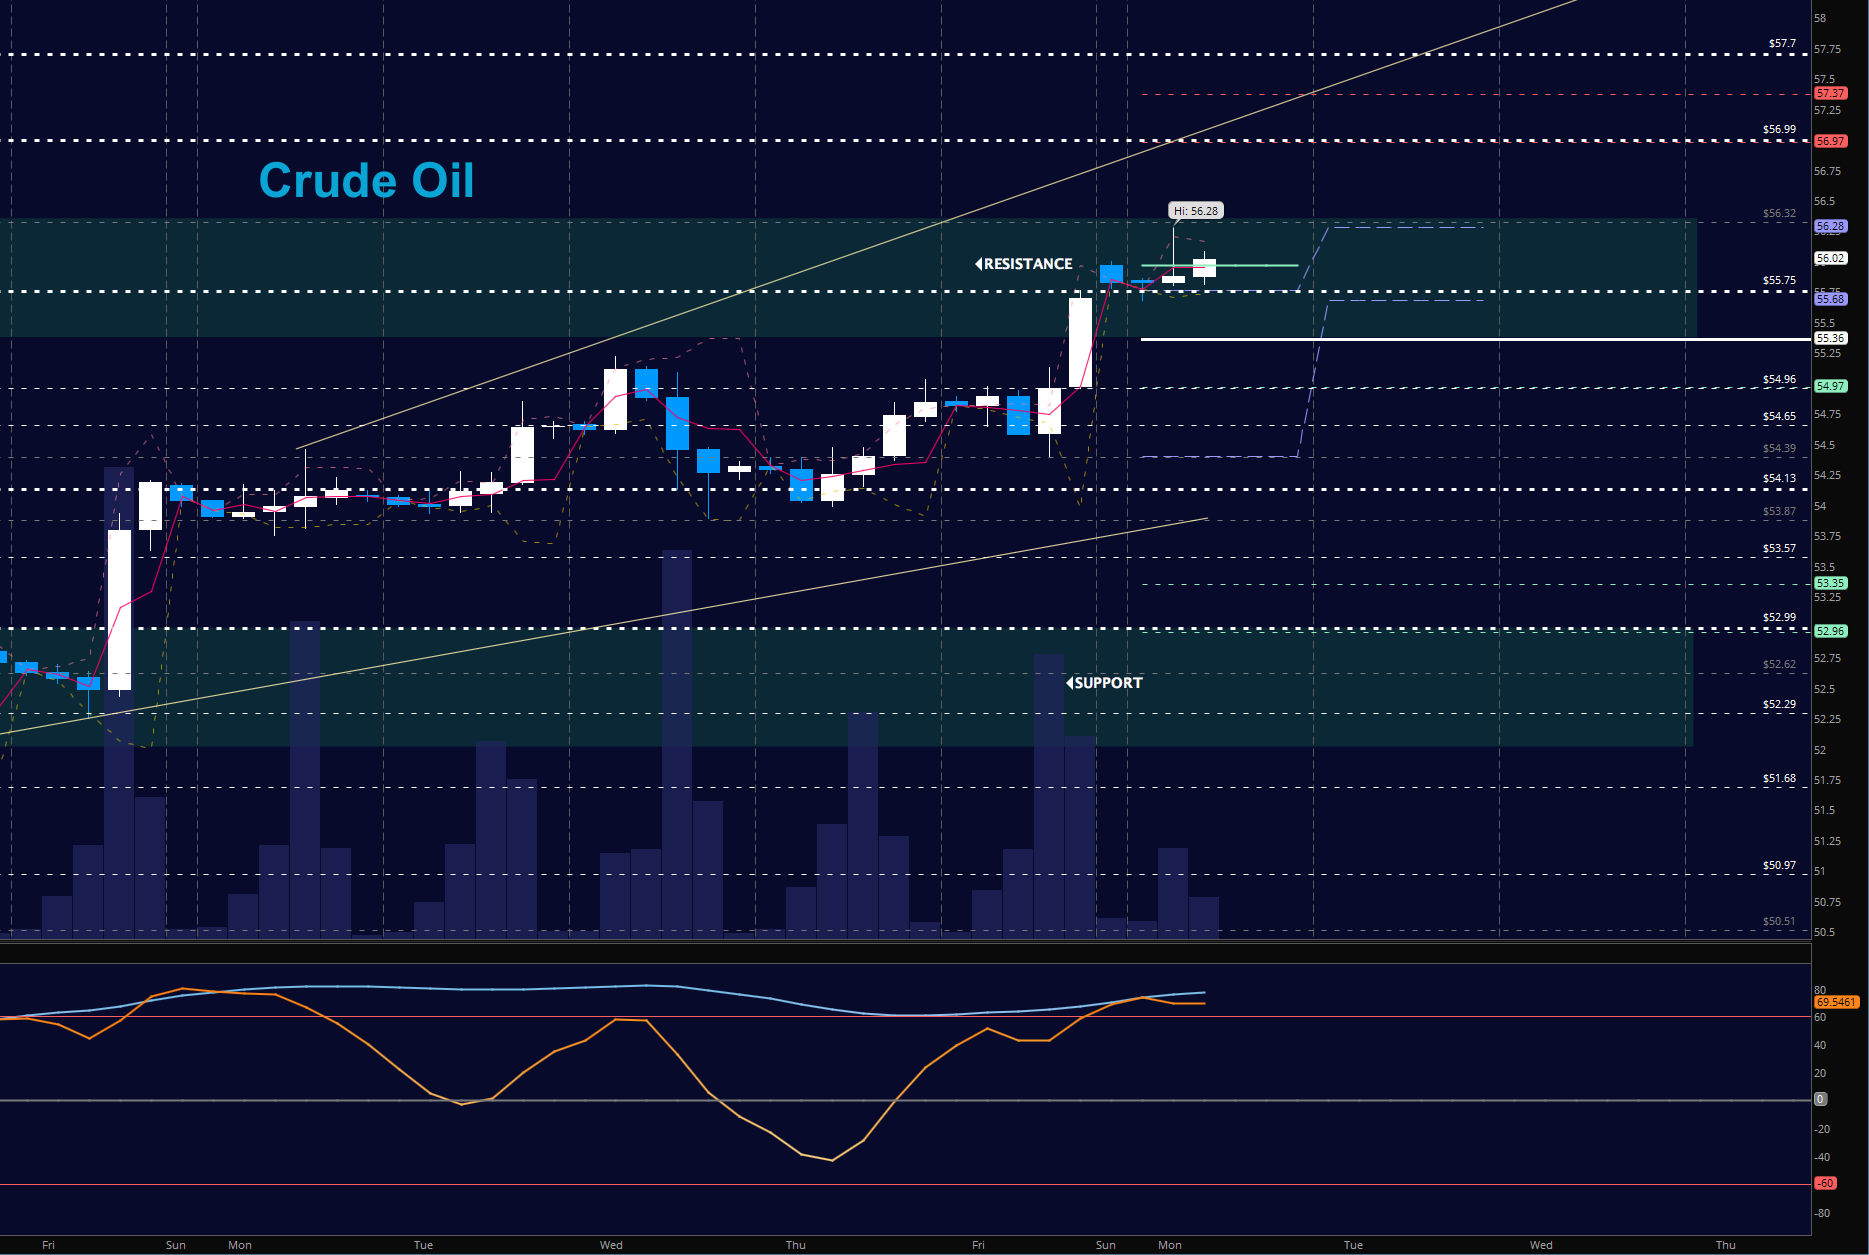
WTI Crude Oil
Oil holds bullish formations with HIGHER LOWS and HIGHER HIGHS. Momentum is bullish allowing pullbacks into support to be key buy zones. The bullets below represent the likely shift of trading momentum at the positive or failed tests at the levels noted.
- Buying pressure intraday will likely strengthen with a positive retest of 56.35
- Selling pressure intraday will strengthen with a failed retest of 55.36
- Resistance sits near 55.75 to 56.27, with 56.75 and 57.7 above that.
- Support holds between 54.97 to 54.4, with 54.13 and 53.87 below that.
If you’re interested in the live trading room, it is now primarily stock market futures content, though we do track heavily traded stocks and their likely daily trajectories as well – we begin at 9am with a morning report and likely chart movements along with trade setups for the day.
As long as the trader keeps himself aware of support and resistance levels, risk can be very adequately managed to play in either direction as bottom picking remains a behavior pattern that is developing with value buyers and speculative traders.
Twitter: @AnneMarieTrades
The author trades stock market futures every day and may have a position in mentioned securities at the time of publication. Any opinions expressed herein are solely those of the author, and do not in any way represent the views or opinions of any other person or entity.


