Stock Market Futures Trading Considerations For May 9, 2017
The S&P 500 (INDEXSP:.INX) traded sideways on Monday following the French elections. Prices still look higher but divergences are forming. Read more below.
Check out today’s economic calendar with a full rundown of releases. And note that the charts below are from our premium service at The Trading Book and are shared exclusively with See It Market readers.
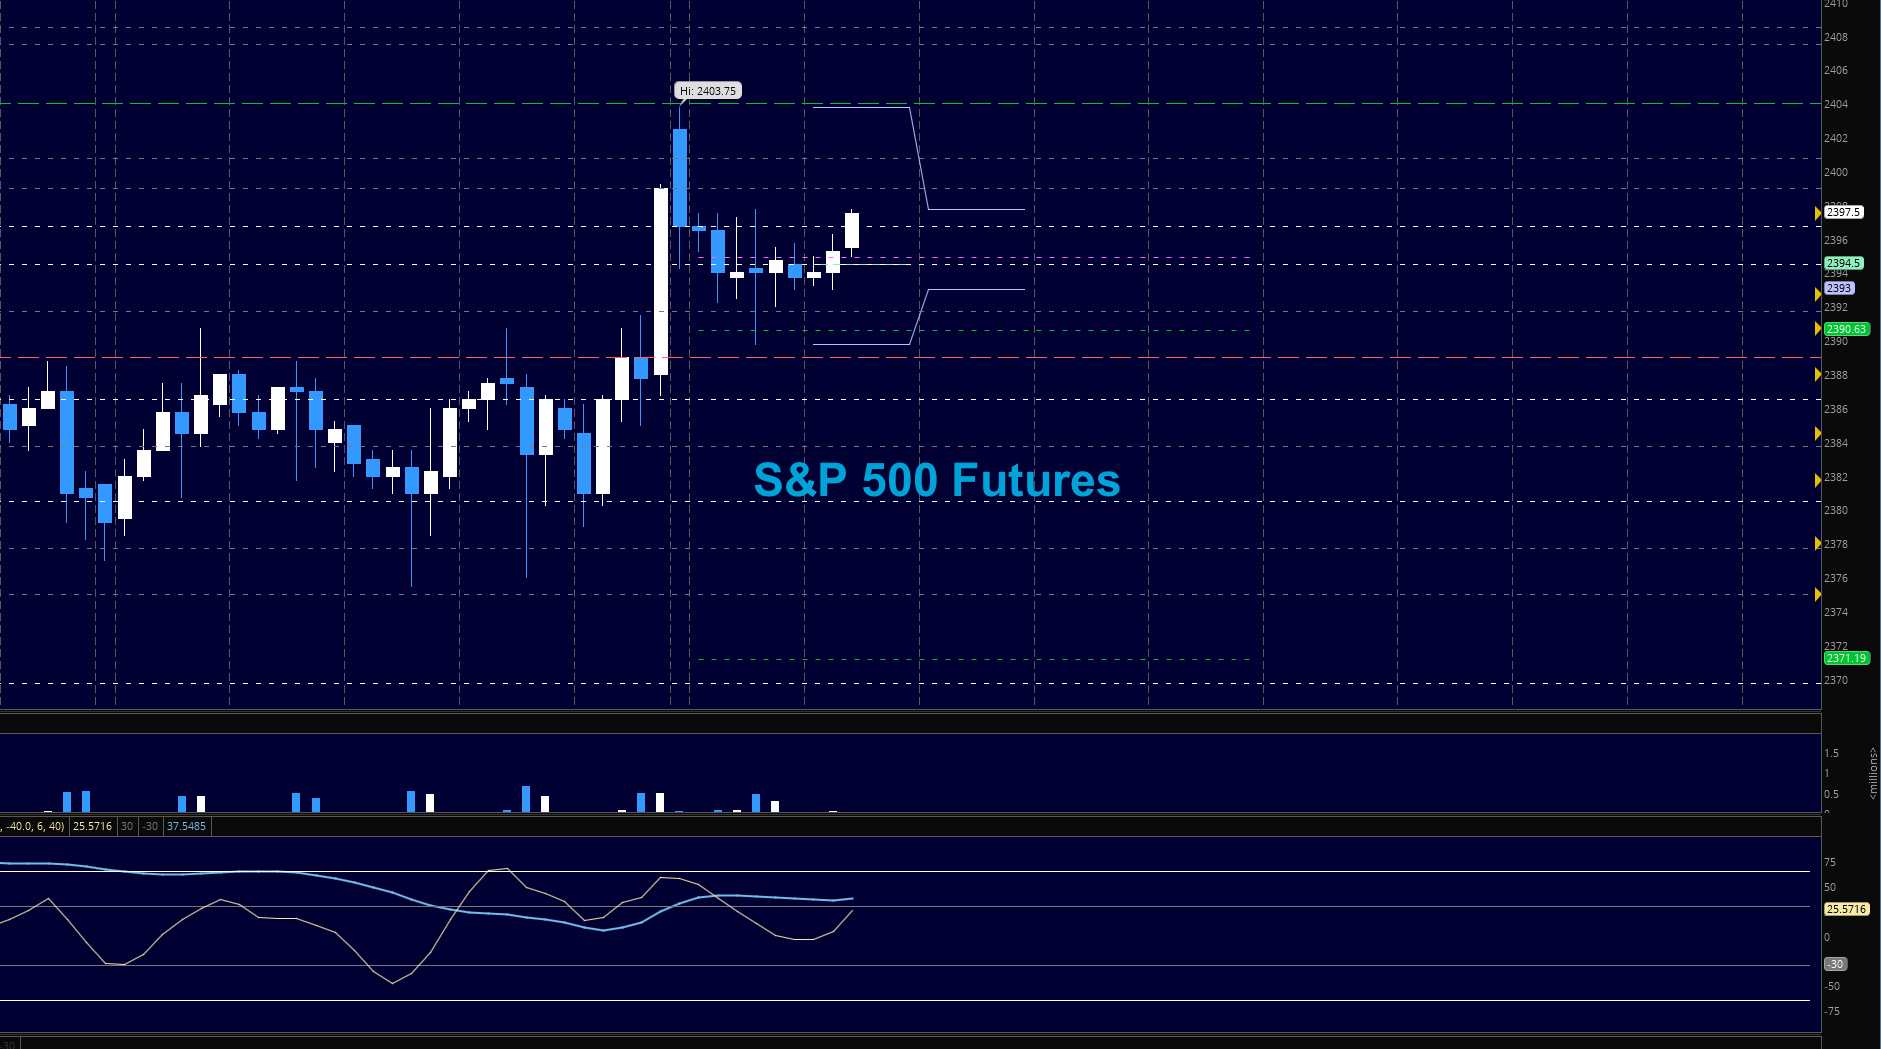
S&P 500 Futures (ES)
The support levels near 2392.5 are holding this morning as momentum has turned decidedly bullish. Though divergence exists in some spaces, price continues to move north. The bullets below represent the likely shift of trading momentum at the positive or failed tests at the levels noted – Levels near 2390 and 2397.5 are key battleground zones today.
- Buying pressure intraday will likely strengthen above a positive retest of 2397.5
- Selling pressure intraday will likely strengthen with a failed retest of 2390
- Resistance sits near 2397.5 to 2400.5, with 2404.75 and 2411 above that
- Support holds between 2389 and 2383.75, with 2380.5 and 2377.75 below that
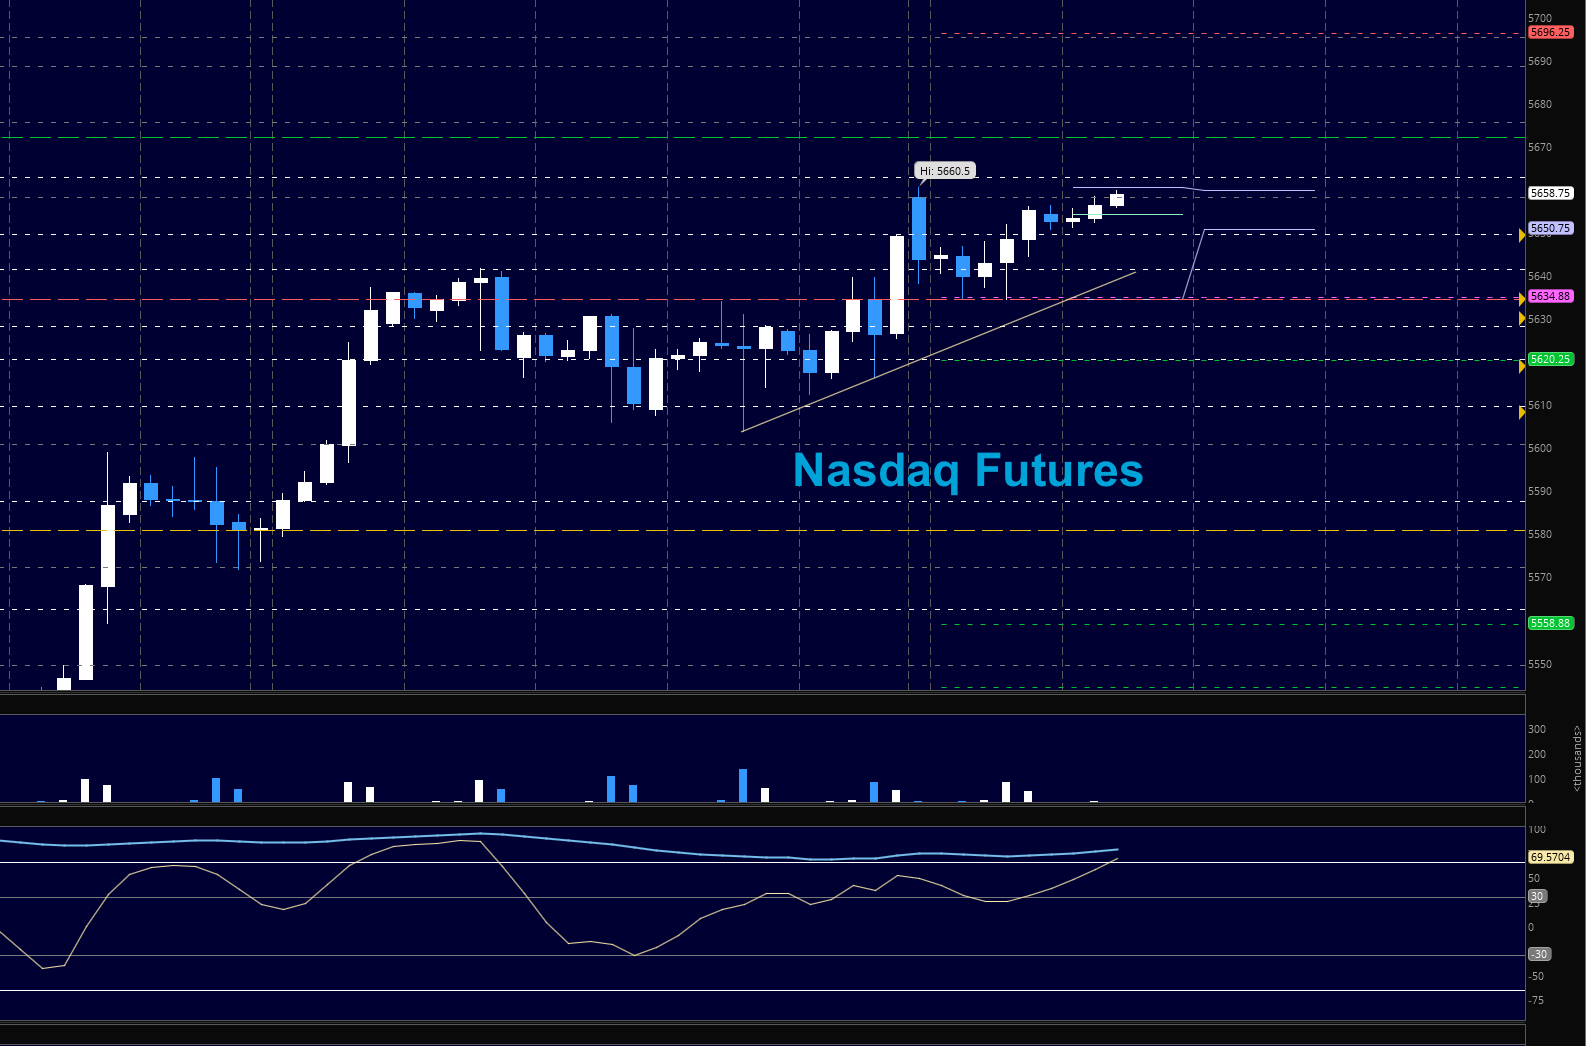
NASDAQ Futures
Wedge continues building under positive momentum suggesting a positive break into next targets, though value areas of support are best for entry long. Our ranges continue to tighten with higher lows. The bullets below represent the likely shift of trading momentum at the positive or failed tests at the levels noted.
- Buying pressure intraday will likely strengthen with a positive retest of 5658.5
- Selling pressure intraday will likely strengthen with a failed retest of 5648.5
- Resistance sits near 5658.5 to 5662.25, with 5667.5 and 5672.5 above that
- Support holds between 5634.75 and 5628.25, with 5620.75 and 5609.5 below that
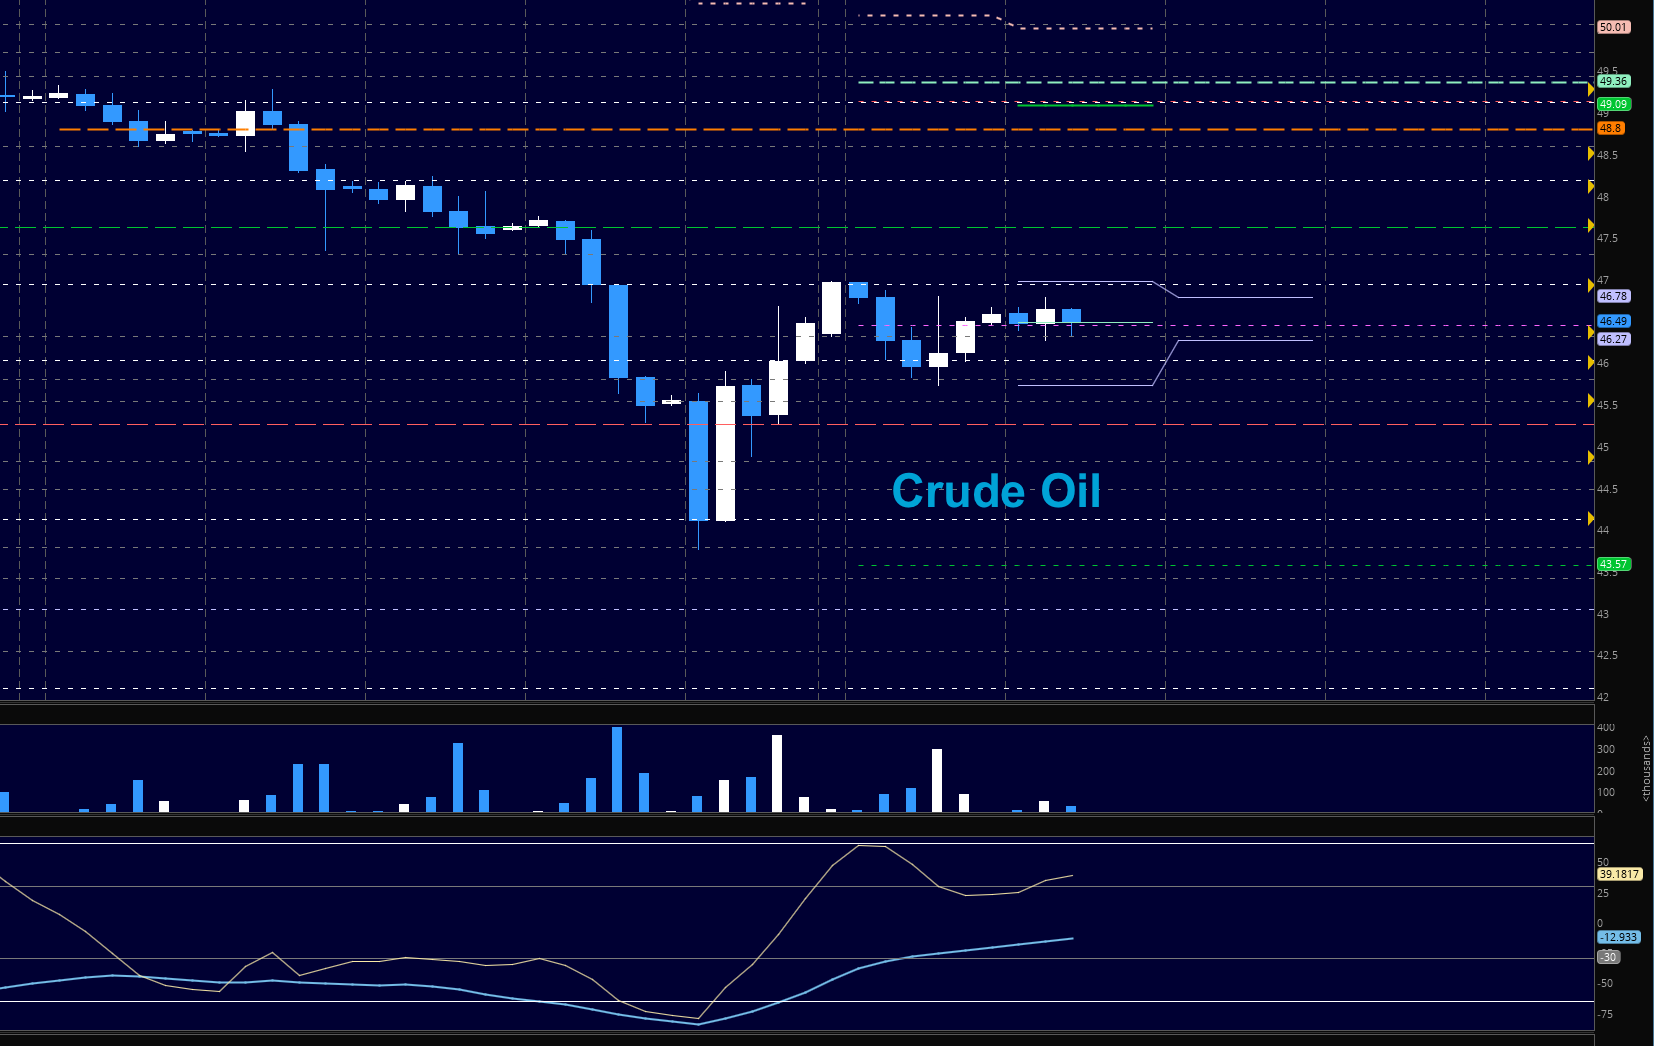
Crude Oil –WTI
OPEC struggles to regain the narrative of higher prices as buyers prop us up with higher lows into the API meeting after the close today. We are tightening ranges with both lower highs and higher lows. I suspect if we breach and hold 46.96, we will likely squeeze up into the initial breakdown of near 47.3 to 47.6, but the attempt to break 46.78 has failed so far. The bullets below represent the likely shift of trading momentum at the positive or failed tests at the levels noted.
- Buying pressure intraday will likely strengthen with a positive retest of 46.96
- Selling pressure intraday will strengthen with a failed retest of 46.27
- Resistance sits near 46.65 to 46.96, with 47.3 and 47.64 above that.
- Support holds between 46.27 and 45.82, with 45.54 and 45.27 below that.
Our live trading room is now primarily stock market futures content, though we do track heavily traded stocks and their likely daily trajectories as well – we begin at 9am with a morning report and likely chart movements along with trade setups for the day.
As long as the trader keeps himself aware of support and resistance levels, risk can be very adequately managed to play in either direction as bottom picking remains a behavior pattern that is developing with value buyers and speculative traders.
Twitter: @AnneMarieTrades
The author trades stock market futures every day and may have a position in mentioned securities at the time of publication. Any opinions expressed herein are solely those of the author, and do not in any way represent the views or opinions of any other person or entity.


: All Energy Hands on Deck!")

: All Energy Hands on Deck!")

