S&P 500 Futures Considerations For March 9, 2017
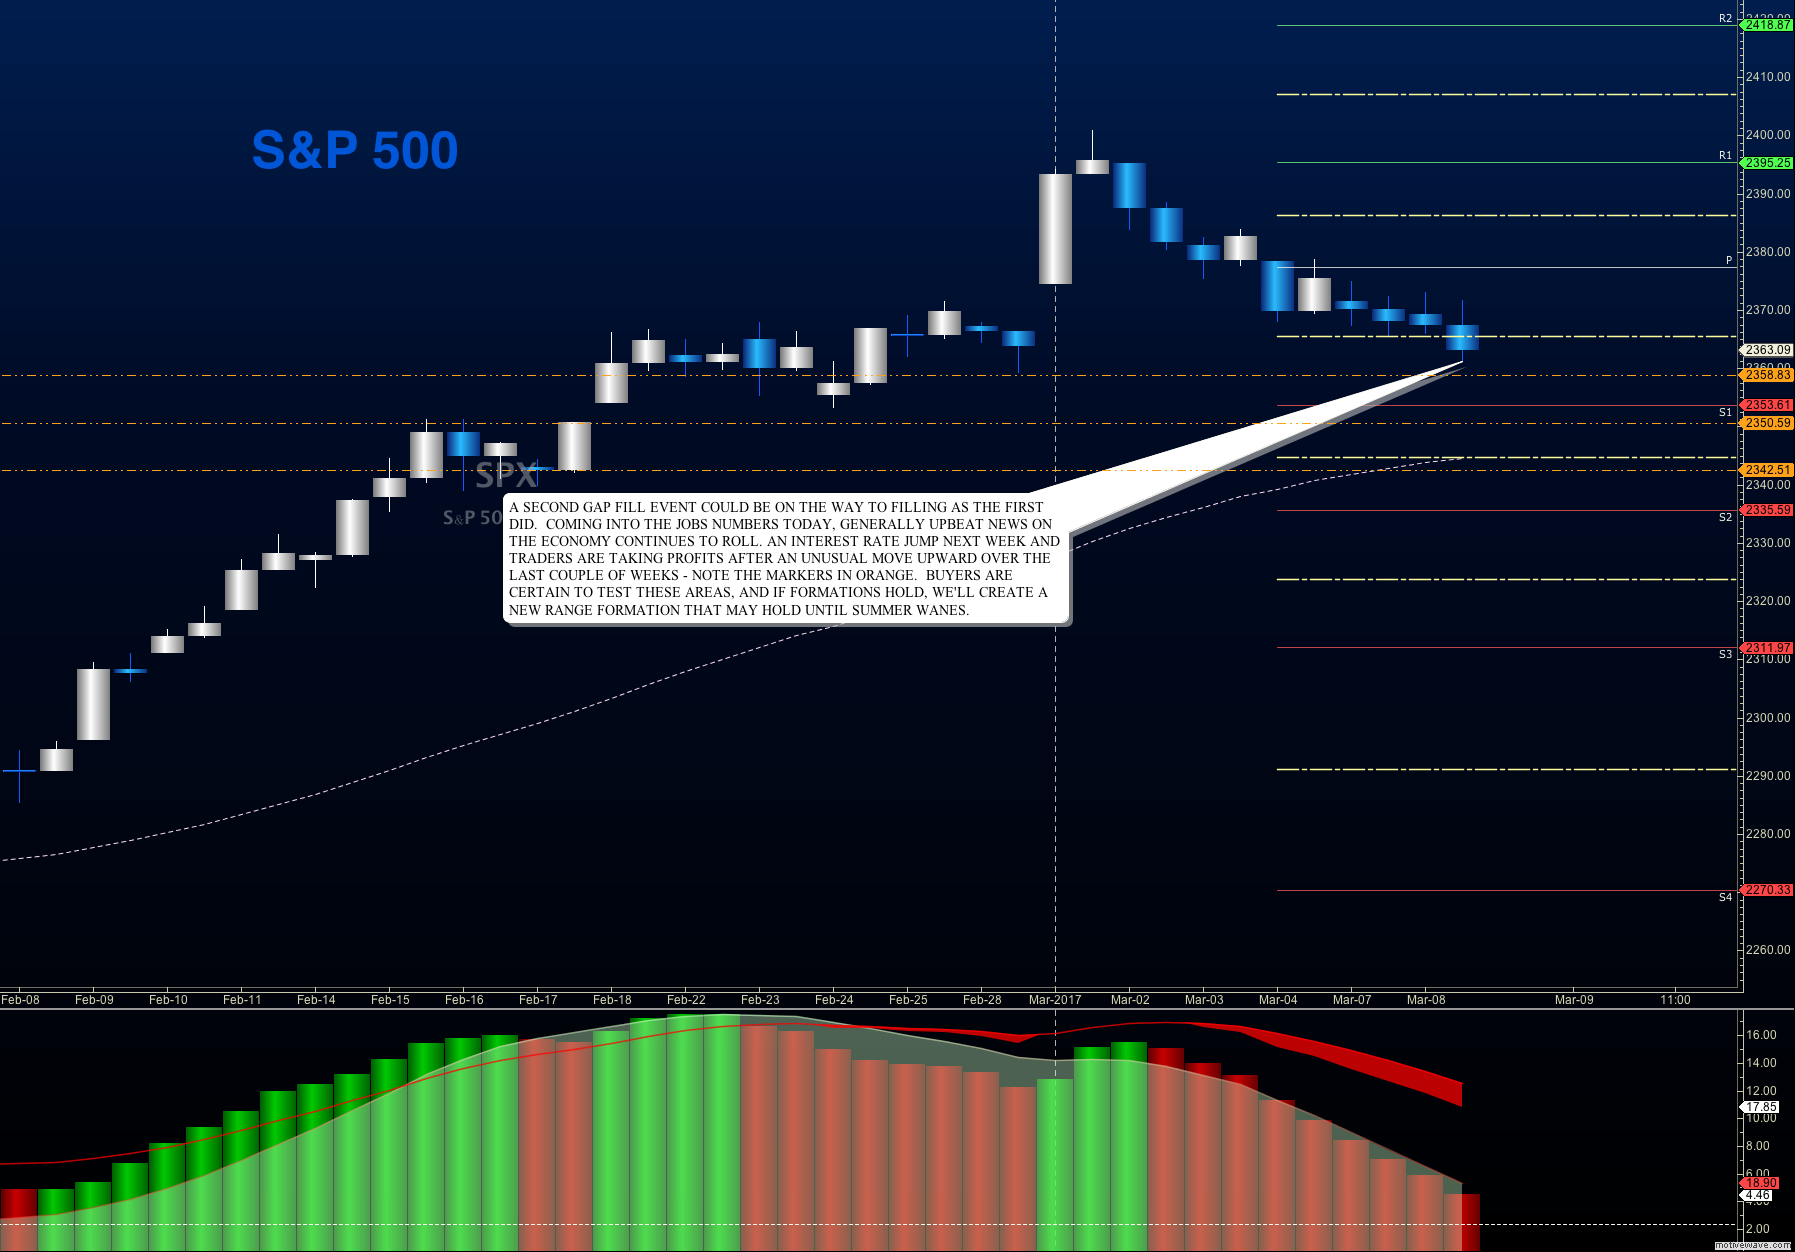
Buyers are attempting to defend key support near 2359, but bounces may bring another set of lower highs (irrespective of jobs numbers, as I see it). If traders held on through the run, they are very likely to preserve profits. On the other side, however, are many more traders who are afraid they missed out on the big move and are now seeing opportunities to enter with less risk exposure. Mixed bag today, but looking for support to hold on the S&P 500 (INDEXSP:.INX).
Buying pressure will likely strengthen above a positive retest of 2374.5, while selling pressure will likely strengthen with a failed retest of 2356.5
Price resistance sits near 2375.5 to 2380.75, with 2389.5 and 2403.75 above that. Price support holds between 2360 and 2357.25, with 2355.5 and 2349.25 below that
See today’s economic calendar with a rundown of releases.
TRADING SETUPS
E-mini S&P Futures
Upside trades – Two options for entry
- Positive retest of continuation level -2369.75
- Positive retest of support level– 2361.25
- Opening targets ranges – 2364, 2366.5, 2372.5, 2375.75, 2380.5, 2382.75, 2385.75, 2389.5, 2393.5, 2397.75, 2400.5, 2404, 2411.75
Downside trades – Two options for entry
- Failed retest of resistance level -2369
- Failed retest of support level– 2358.5
- Opening target ranges – 2366.75, 2363.5, 2360.5, 2358.75, 2355.25, 2351.5, 2346.25, 2343.25, 2337.5, 2334, 2329.25
NASDAQ Futures
The NQ_F enters its sixth day in the range between 5374.5 and 5337.75. With neutral momentum showing on tighter time frames, it appears that the chart will keep range bound, with catalysts for movement stretching the chart out of its range and returning to the congestion noted.
- Buying pressure will likely strengthen with a positive retest of 5374.75
- Selling pressure will likely strengthen with a failed retest of 5331.25
- Resistance sits near 5374.75 to 5382.75, with 5392.5 and 5398.25 above that
- Support holds between 5331.25 and 5324.25, with 5319.5 and 5311.75 below that
Upside trades – Two options
- Positive retest of continuation level -5366.25
- Positive retest of support level– 5348.5
- Opening target ranges – 5354.25, 5357.5, 5361.25, 5365.5, 5370.5, 5374.75, 5380.25, 5383.75, 5388.25, 5398, 5404, 5411.5, 5422.25
Downside trades- Two options
- Failed retest of resistance level -5356.5
- Failed retest of support level– 5343.25
- Opening target ranges – 5353.5, 5349, 5344, 5337.75, 5333.25, 5327.75, 5324.75, 5319.75, 5312.75, 5306.5, 5297.75, 5294.25, 5291.25, 5286.75, 5277.75
Crude Oil –WTI
Oil charts are in a breathtaking fall as trapped hedge funds rushed to liquidate. We now hold near favorable short term bounce zones near 49 to 48.6. Charts are very extended, no doubt amplified by trend and momentum following algorithms. I’ll be looking at the bounces to fail as buyers are trapped still, but the longer we hold there regions near 49, the more likely we hold there- at least for the time being.
- Buying pressure will likely strengthen with a positive retest of 50.09
- Selling pressure will strengthen with a failed retest of 48.6
- Resistance sits near 50.22 to 50.84, with 51.3 and 51.8 above that.
- Support holds between 49.04 and 48.6, with 47.84 and 46.98 below that.
Upside trades – Two options
- Positive retest of continuation level -49.54
- Positive retest of support level– 49.22
- Opening target ranges – 49.51, 49.89, 50.12, 50.6, 50.84, 51.27, 51.7, 52.17
Downside trades- Two options
- Failed retest of resistance level -50.12
- Failed retest of support level– 49.24
- Opening target ranges – 49.54, 49.08, 48.88, 48.6, 48.4, 47.92, 47.42, 46.98, 45.94
If you’re interested in the live trading room, it is now primarily stock market futures content, though we do track heavily traded stocks and their likely daily trajectories as well – we begin at 9am with a morning report and likely chart movements along with trade setups for the day.
As long as the trader keeps himself aware of support and resistance levels, risk can be very adequately managed to play in either direction as bottom picking remains a behavior pattern that is developing with value buyers and speculative traders.
Twitter: @AnneMarieTrades
The author trades stock market futures every day and may have a position in mentioned securities at the time of publication. Any opinions expressed herein are solely those of the author, and do not in any way represent the views or opinions of any other person or entity.

: Creating Bullish Divergence?")

: Creating Bullish Divergence?")


