Stock Market futures Considerations For March 17, 2017
I am looking at 5440.75 on Nasdaq futures being a temporary high for now as we consolidate at higher lows. The move that spiked gold with the charts may have been a stop running move as volume there was a bit lower, though Goldman Sachs sent a buy rating out on this on.
Check out today’s economic calendar with a full rundown of releases. And note that the charts below are from our premium service and shared exclusively with See It Market readers.
S&P 500 Futures (ES)
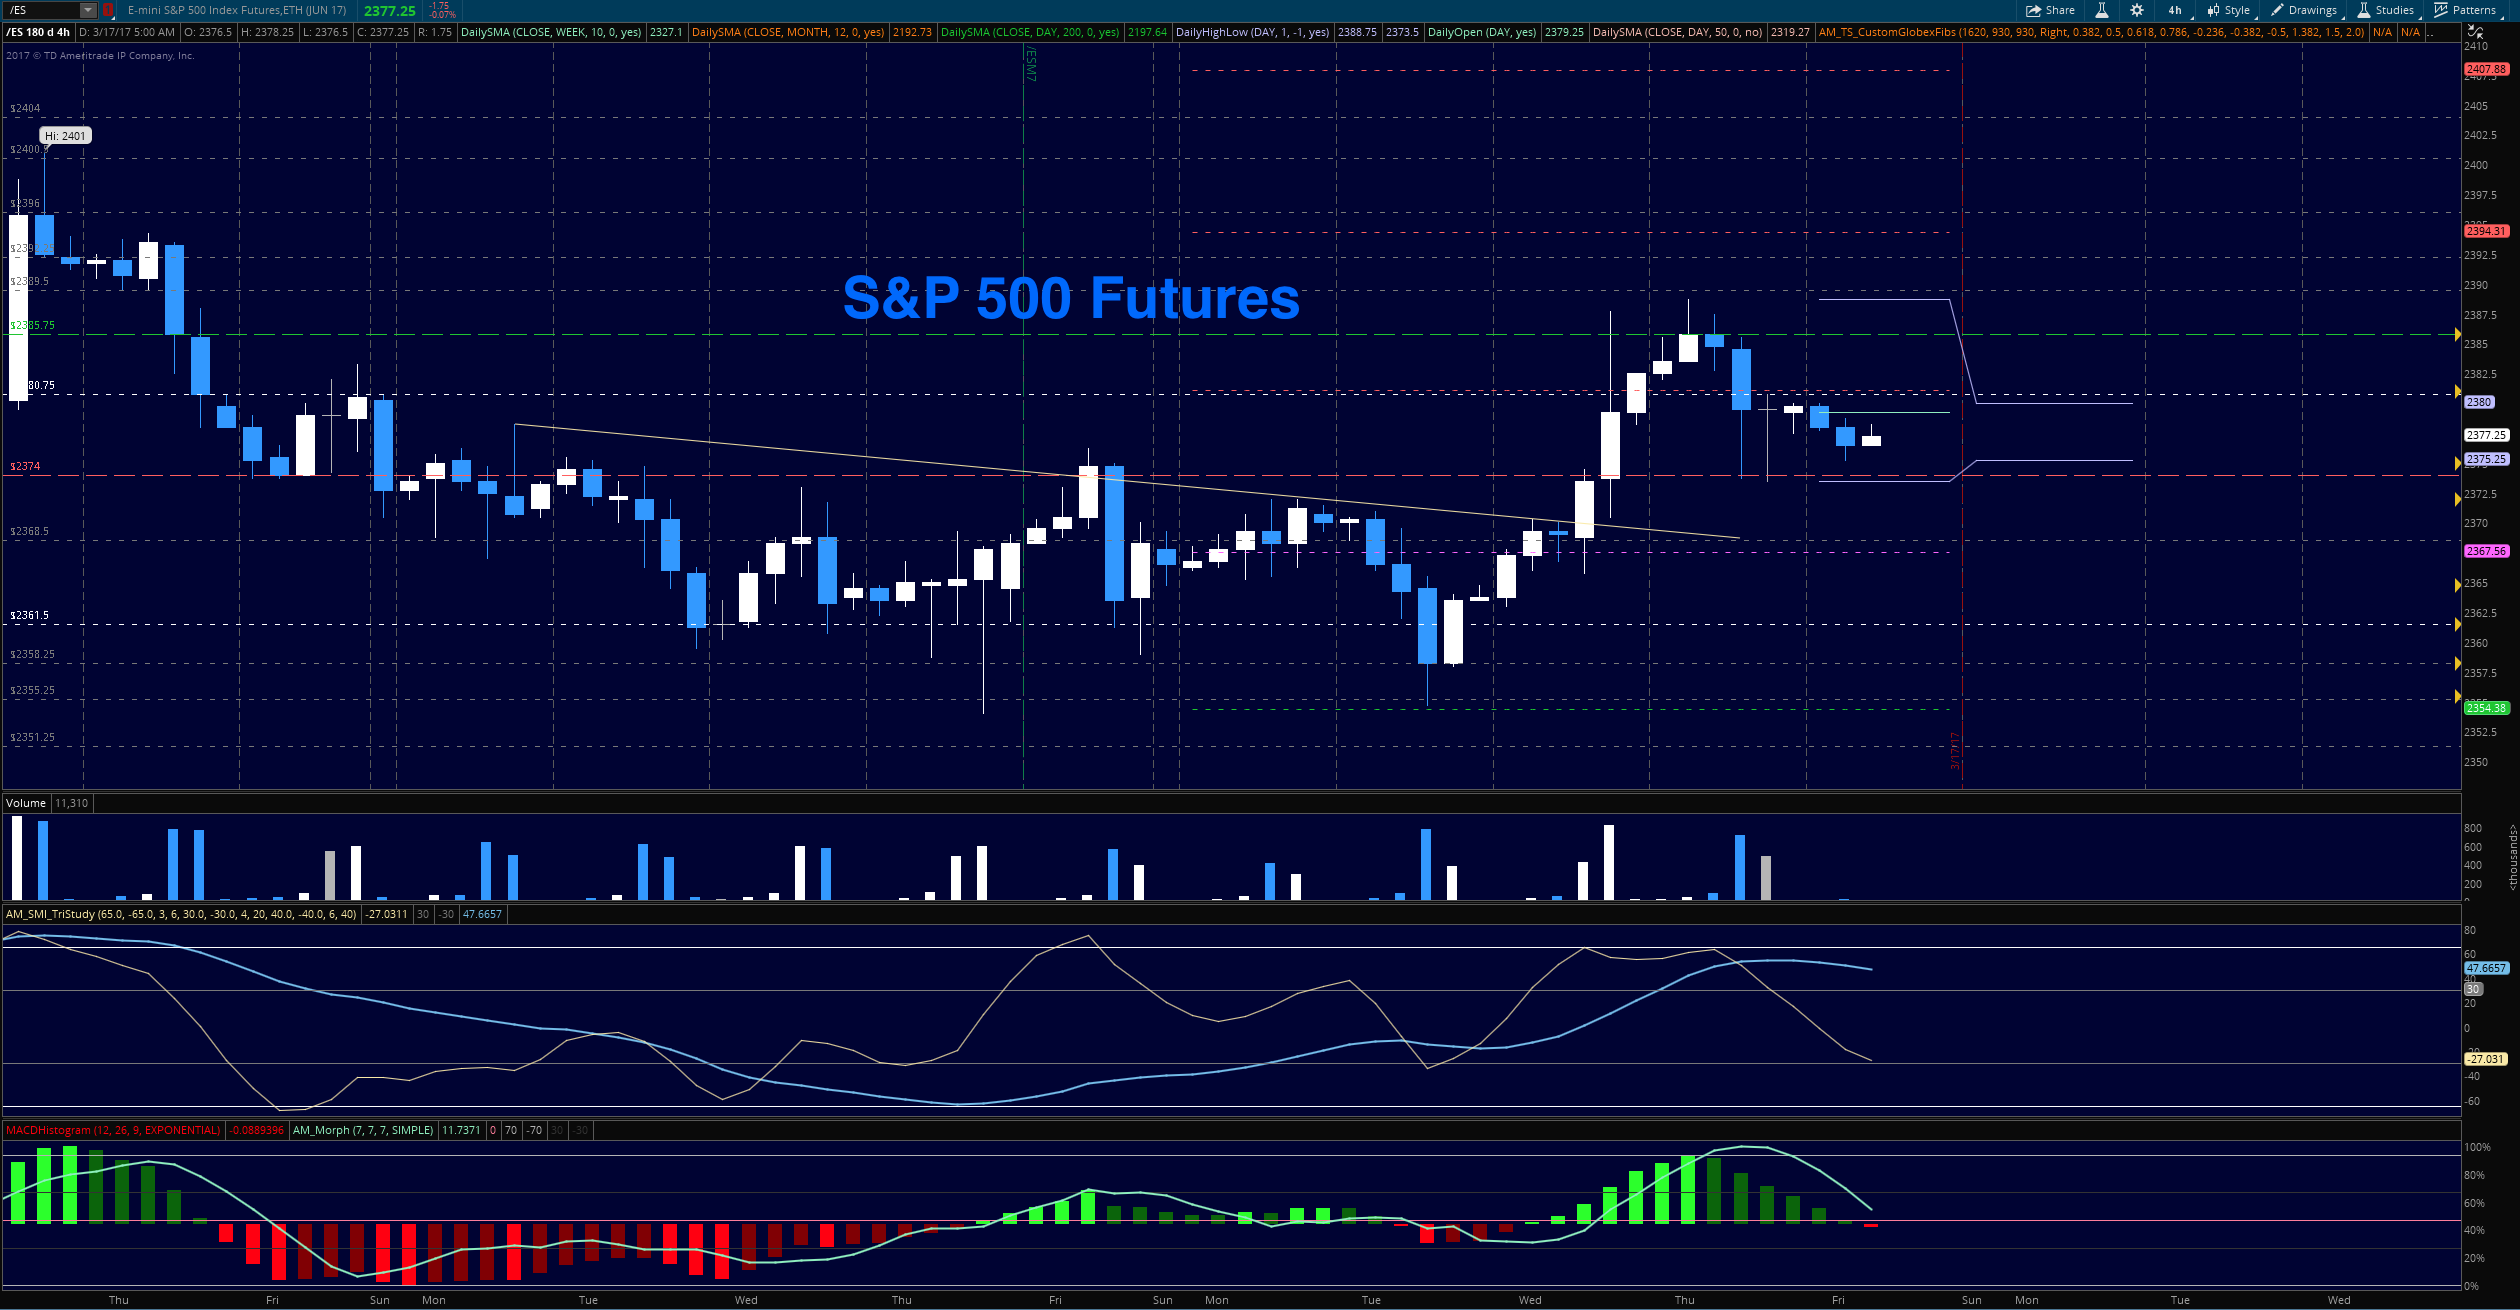
We should have some sideways consolidation action on the S&P 500 (INDEXSP:.INX) for the next few trading days, perhaps between 2259 and 2292. The lower high presenting near 2290 is the troubling point to watch. However, above 2270.5 keeps bulls brave, but below that use caution if anticipating pure upside motion. A hold of 2280.50 opens the upside tests into resistance while a failed retest of 2378 opens the test of 2375
- Buying pressure will likely strengthen above a positive retest of 2385.5 (use caution here as 2389 looms just above)
- Selling pressure will likely strengthen with a failed retest of 2372.5
- Resistance sits near 2389.5 to 2392.75, with 2394.5 and 2397.75 above that
- Support holds between 2375.25 and 2368.5, with 2361.5 and 2354.5 below that
NASDAQ Futures (NQ)
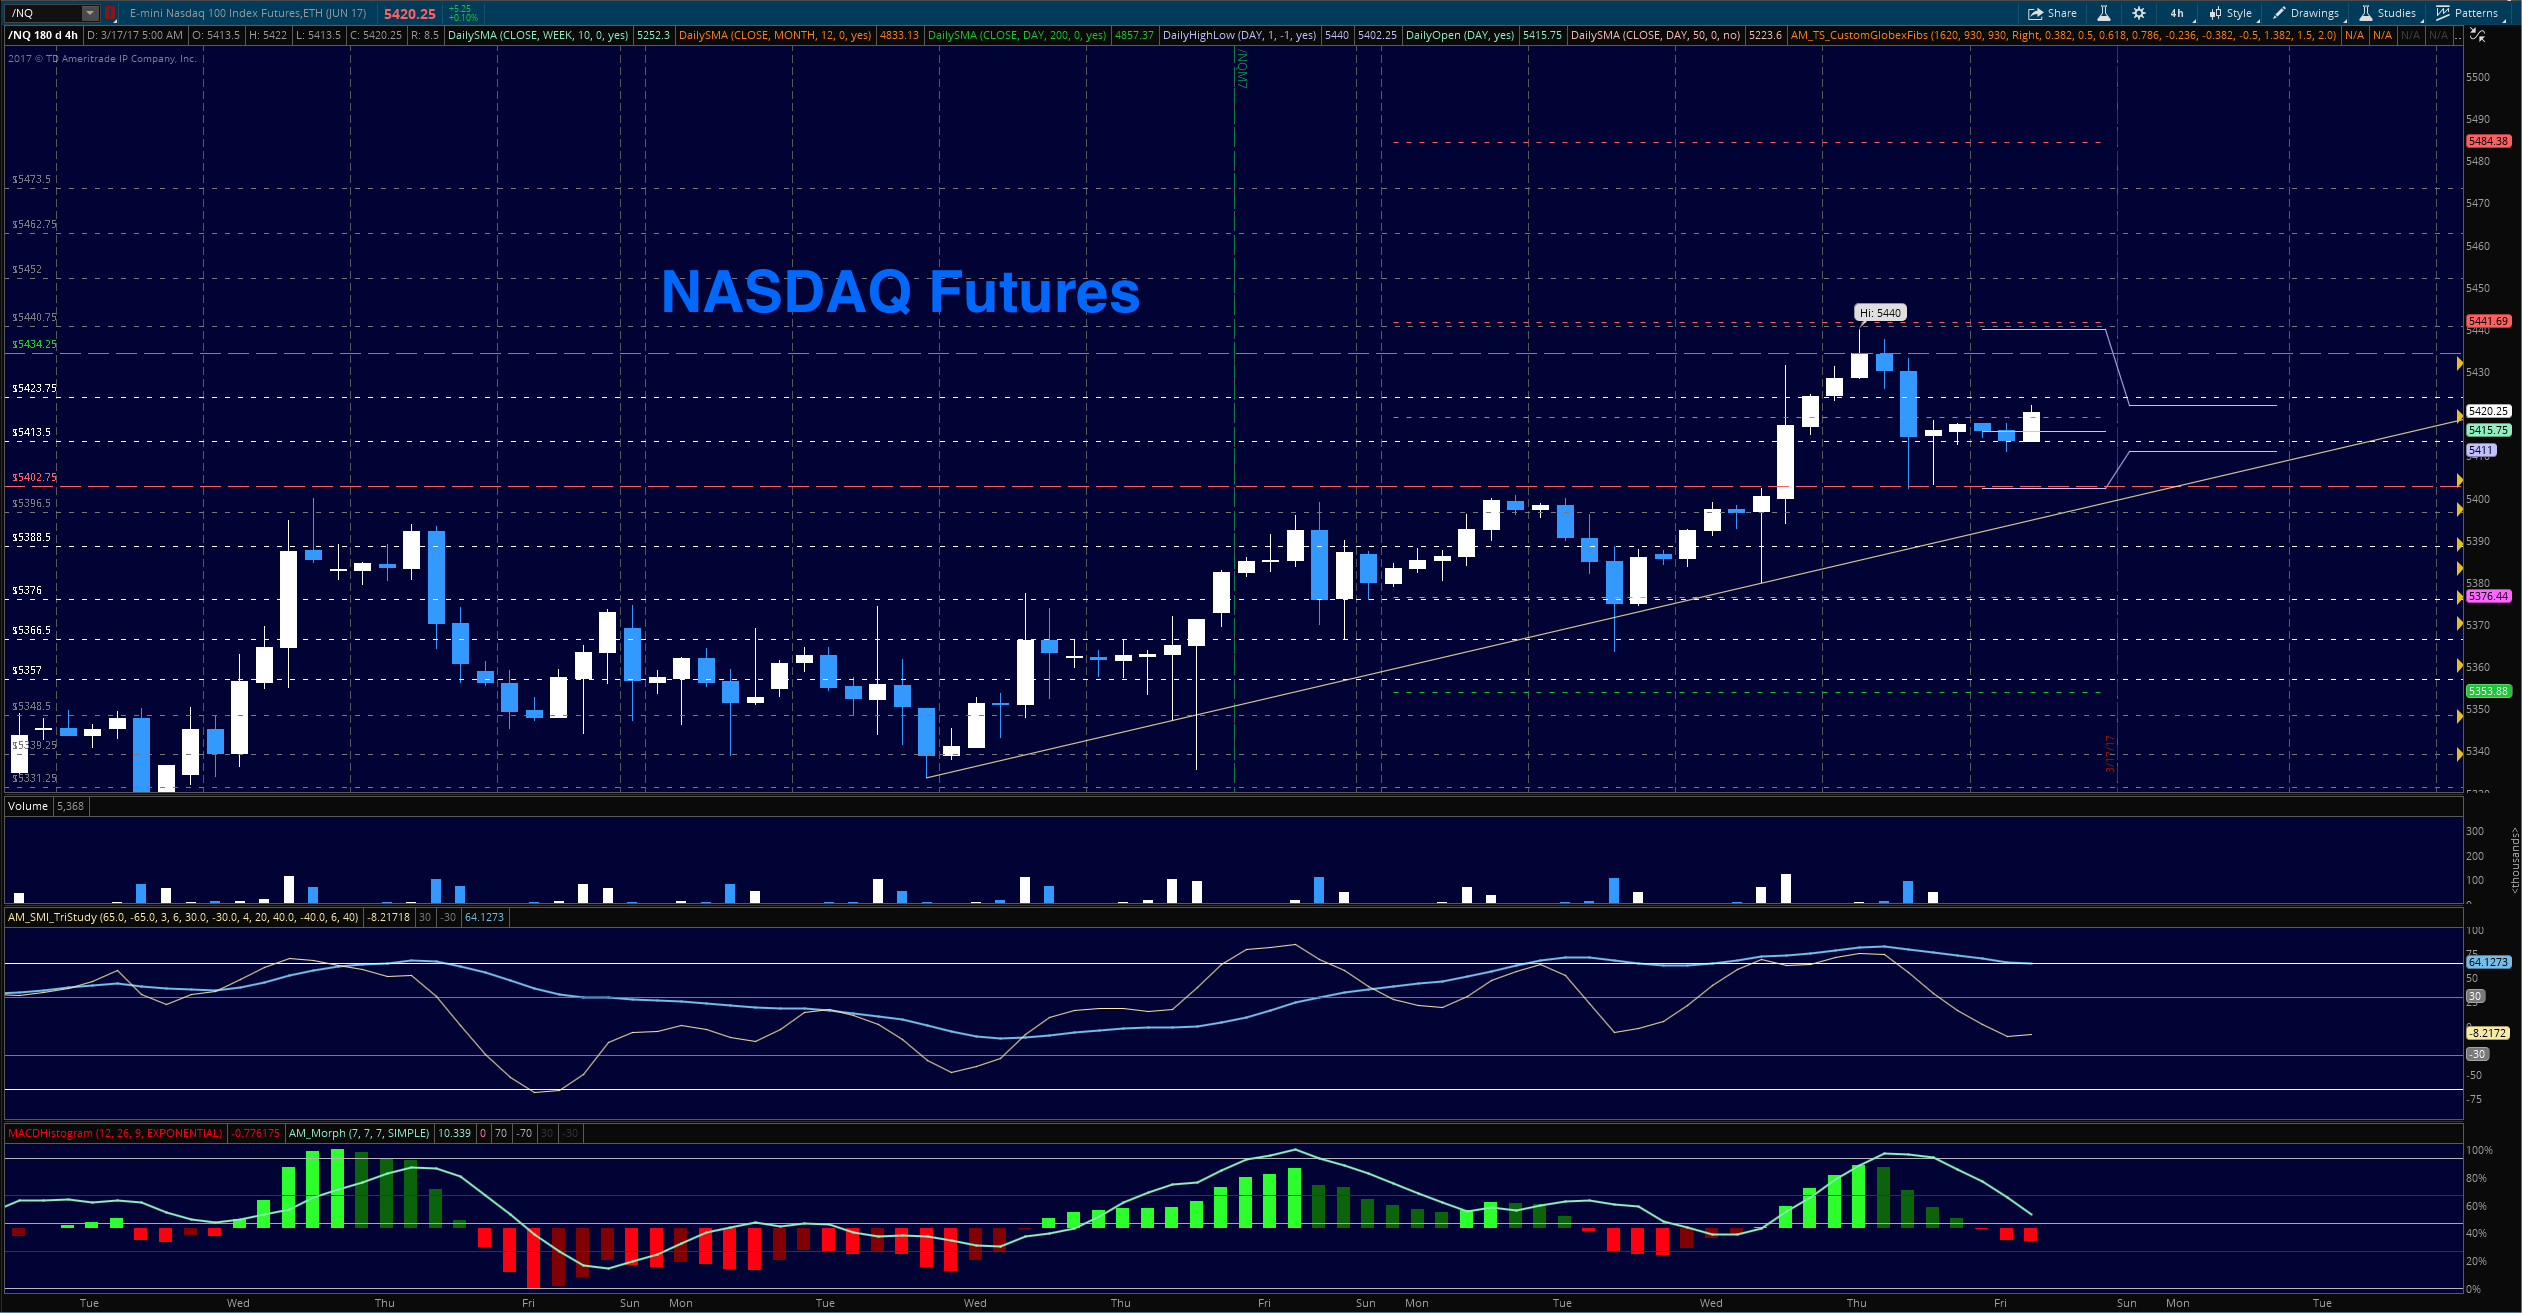
Nasdaq futures hold bullish formations as traders brought higher low formations to the chart as participants continue to view tech favorably in the environment. New highs from Wednesday will hold as resistance. We expect some kind of pullback into higher lows and new consolidation which will strengthen the chart overall. Fibonacci resistance levels noted are 5440.25. Gann numbers higher show as 5252 and 5262.75, but it seems fairly unlikely that we press higher. It is much more likely that we move to test areas between 5400 and 5434
- Buying pressure will likely strengthen with a positive retest of 5427.75 (use caution and wait for a retest).
- Selling pressure will likely strengthen with a failed retest of 5412.
- Resistance sits near 5427.5 to 5434.5, with 5440.75 and 5445.5 above that.
- Support holds between 5411.75 and 5402.5, with 5396.5 and 5392.75 below that.
Crude Oil –WTI
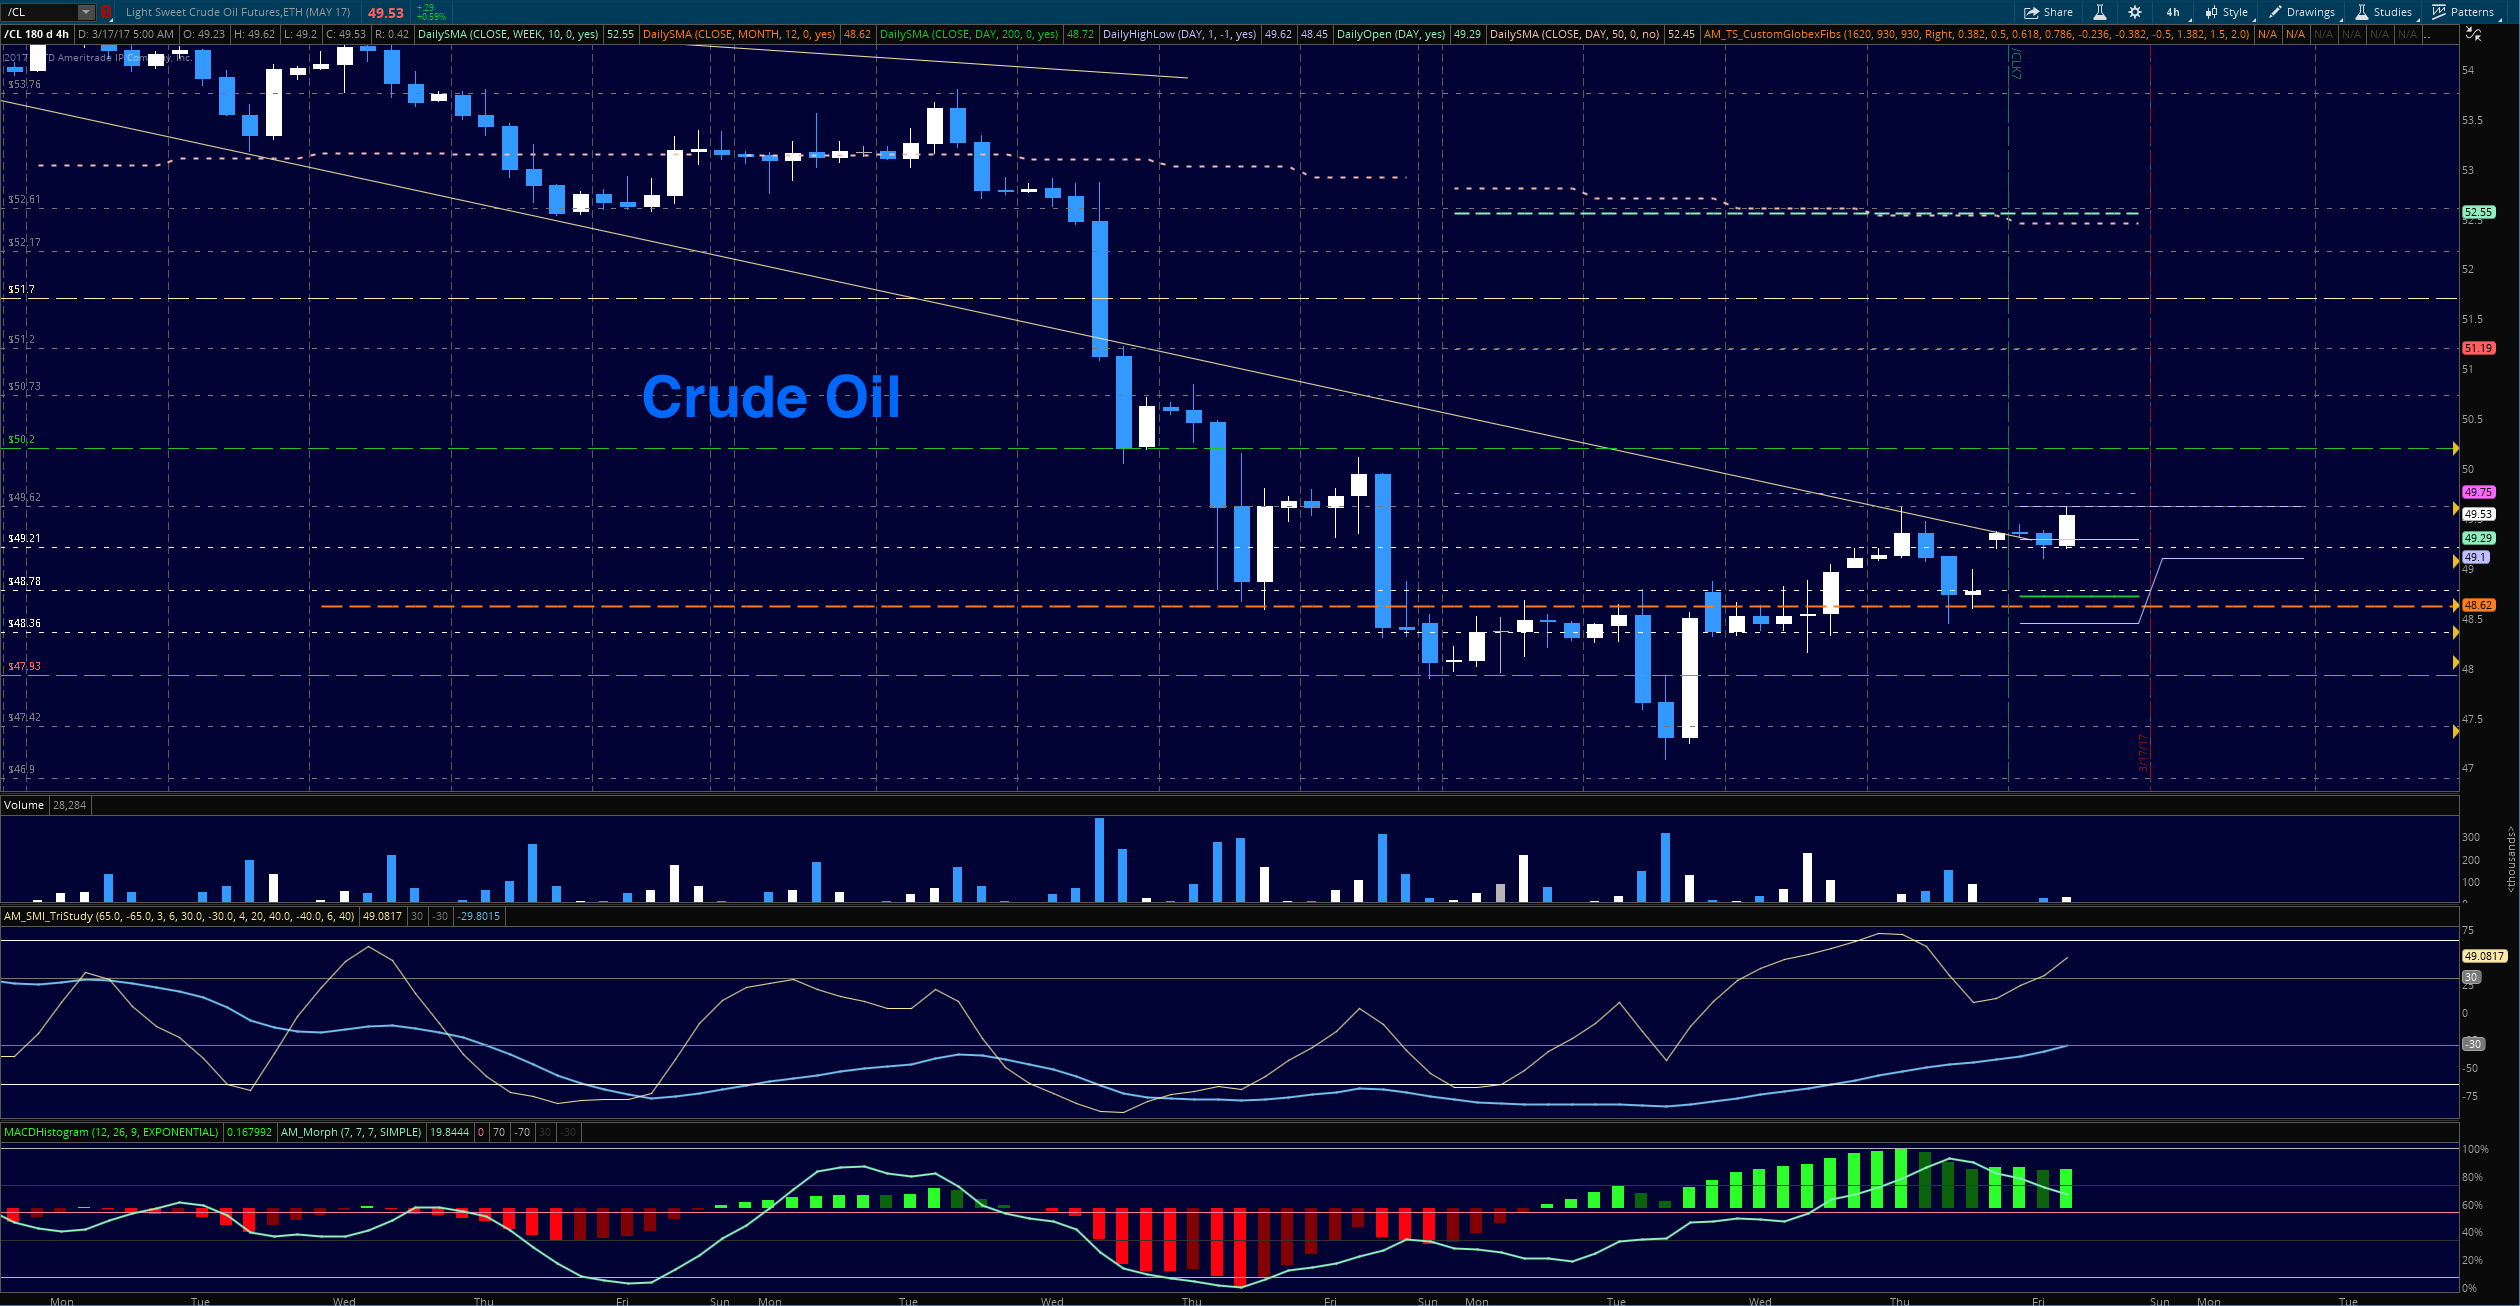
Oil is attempting a base- shaking weak longs out of the trade over prior days – today, we’ll find out later how many more hedge funds liquidated portions of their long positions. We should hold support and continue a bit range bound here as the traders try to stabilize price. Momentum is mixed across time frames, suggesting choppy action in the absence of news. Should news spike the charts in either direction, we should return to the ranges defined between 47.4 and 50.06 seen in the image of WTI. and there are still a lot of traders that are quite long in their positions. The latest cycle shows higher lows and higher highs, and we did have a contract roll into the front month. A stretch into 50 will likely bring new trapped longs into the liquidation space.
- Buying pressure will likely strengthen with a positive retest of 50.20 (be careful here).
- Selling pressure will strengthen with a failed retest of 47.90.
- Resistance sits near 49.74 to 50.08, with 50.62 and 51.14 above that.
- Support holds between 48.36 and 47.9, with 47.42 and 46.91 below that.
If you’re interested in watching these trades go live, join us in the live trading room from 9am to 11:30am each trading day.
Visit TheTradingBook for more information.
If you’re interested in the live trading room, it is now primarily stock market futures content, though we do track heavily traded stocks and their likely daily trajectories as well – we begin at 9am with a morning report and likely chart movements along with trade setups for the day.
As long as the trader keeps himself aware of support and resistance levels, risk can be very adequately managed to play in either direction as bottom picking remains a behavior pattern that is developing with value buyers and speculative traders.
Twitter: @AnneMarieTrades
The author trades stock market futures every day and may have a position in mentioned securities at the time of publication. Any opinions expressed herein are solely those of the author, and do not in any way represent the views or opinions of any other person or entity.

 Testing Important Price Support")
: Cup (and Maybe Handle) Watch")

