Stock Market Futures Outlook for June 27, 2016 – S&P 500 futures bounced on Friday but has failed to hold gains as markets across the seas are down again in the wake of the EU referendum in Britain. If S&P 500 futures dip below 1999, we see another support level near 1994.5, but charts will likely bounce there into resistance. Market volatility will continue to reign until policy is made clear to the markets.
So far, from a policy perspective, globally are now in a giant uncertainty pattern – and that is what investors like least. Failure to hold 2022.5 with any bounces, will bring sellers back into the market and all eyes will be on a very big support region near 1994.5. With a tremendous amount of uncertainty, and the markets like that the least, so I do not expect a big recovery off these levels until we resolve issues. Chart congestion patterns could slip into 1966 to 1976 – buyers will try to exercise strength above 2023, but we remain vulnerable to continued selling as long as we sit below 2023.
See today’s economic calendar with a rundown of releases.
RANGE OF TODAY’S MOTION
E-mini S&P Futures
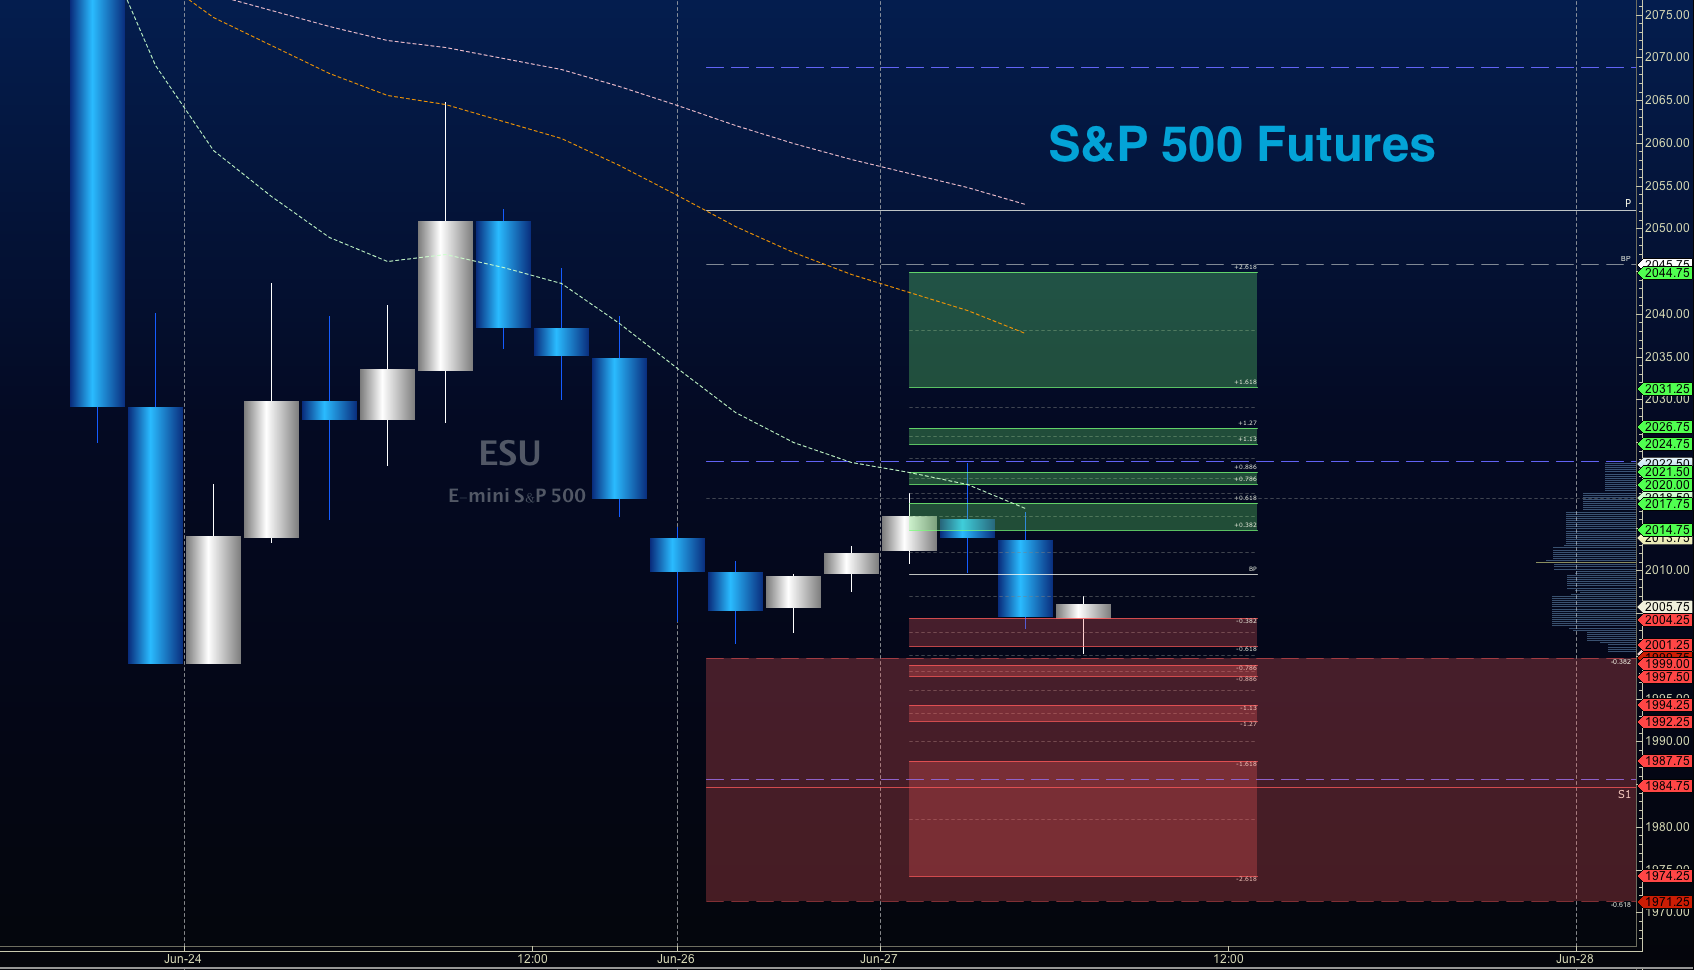
S&P 500 futures trading outlook for June 27, 2016 –
Upside trades on S&P 500 futures – Favorable setups sit on the positive retest of 2014.25, or a positive retest of the bounce off 1996 with positive momentum. Be very careful watching for sellers showing up near 2001, as that could signal that we will return to lower levels. I use the 30min to 1hr chart for the breach and retest mechanic. Targets from 1996 are 1999, 2001.25, 2004.5, 2007.5, 2009.25, 2012.25, 2014.25, 2017.25, 2019.5, 2022.25- resistance watch,2025, 2027.5, 2031.25, 2033.25, 2038.5, 2042.5, 2046.5, 2051.5, 2053.5, 2057.75, 2061.5, and 2066.75.
Downside trades on S&P 500 futures – Favorable setups sit below the failed retest of 2021.25 or at the failed retest of 2009.75 with negative divergence. It is important to watch for higher lows to develop with the 2021.25 entry, as the chart may be attempting recovery. Retracement into lower levels from 2021.25 gives us the targets 2019.5, 2017.25, 2014.25, 2012.5, 2009.75, 2007.5, 2005.75, 2002.75, 2001, 1999.5, 1995-support watch, and perhaps back to a test of 1991.75.
Have a look at the Fibonacci levels marked in the blog for more targets.
Nasdaq Futures
Trading outlook for Nasdaq futures for June 27, 2016 (NQ_F) – Nasdaq futures, unlike the ES_F, has broken the lows of Friday. A weak line of buyers is waiting under the lows here this morning near 4218.5 to 4213. Significant resistance sits near 4250 and 4267. A deep support level sits below that near 4179.25 to 4184.5.
Upside trades on Nasdaq futures – Favorable setups sit on the positive retest of 4250, or a positive retest of 4214.25 with positive momentum. I use the 30min to 1hr chart for the breach and retest mechanic. Intraday resistance sits between 4260-4267. Watch for the lower high to develop in the long opening at 4214.25, if sellers are still holding strong. Targets from 4214.25 are 4218.5, 4222, 4234.5, 4242.25, 4250, 4260.5, 4265.5, 4281.5, 4298, 4306.25, 4311.25, 4320.25, 4322.75, and 4330.25.
Downside trades on Nasdaq futures – Favorable setups sit below the failed retest of 4228.5 or at the failed retest of 4297.5 with negative divergence. Retracement into lower levels from 4297.5 gives us the targets 4294.5, 4286.5, 4277.75, 4274.5, 4266.75, 4256.75, 4238.5, 4234.5, 4227.5, 4222, 4218.25, 4213.5, and perhaps 4186.5 to 4175.5, if sellers accelerate the process.
Crude Oil
Outlook for crude oil for June 27, 2016 (CL_F) – Uncertainty in other markets has taken hold in oil as the WTI crude oil chart continues its decline. At this writing, however, we do have a test of support that should give us a bounce. These bounces are still likely to be sold under the negative conditions.
The trading range on crude oil suggests support action near 45.8, and resistance behavior near 48.47.
Upside trades on crude oil futures can be staged on the positive retest of 47.78, or at a bounce off 47.12 with positive momentum. I often use the 30min to 1hr chart for the breach and retest mechanic. Targets from 47.12 are 47.37, 47.49, 47.75, 47.94, 48.16, 48.43, 48.6, 48.8, and 49.04. Range expansions on surprise movement could extend to 49.47 to 49.74.
Downside trades on crude oil futures can be staged on the failed retest of 47, or at the failed retest of 47.9 with negative divergence. These setups give us targets from 47.9 into 47.74, 47.48, 47.13, 46.89, 46.7, 46.44, and perhaps 46.27 to 45.87.
If you’re interested in the live trading room, it is now primarily stock market futures content, though we do track heavily traded stocks and their likely daily trajectories as well – we begin at 9am with a morning report and likely chart movements along with trade setups for the day.
As long as the trader keeps himself aware of support and resistance levels, risk can be very adequately managed to play in either direction as bottom picking remains a behavior pattern that is developing with value buyers and speculative traders.
Twitter: @AnneMarieTrades
The author trades stock market futures every day and may have a position in mentioned securities at the time of publication. Any opinions expressed herein are solely those of the author, and do not in any way represent the views or opinions of any other person or entity.
: Creating Bullish Divergence?")


: Creating Bullish Divergence?")