The rally from yesterday’s lows continues today, as buyers look to test higher levels of concern.
The whipsaw action is sure to continue as global news has been noisy lately.
The bounce must be monitored closely though. If we do not continue to recover higher levels, then deeper dips are possible. Stay prepared and watch your levels.
S&P 500 Futures
Lower highs hold after a sharp bounce yesterday. Support levels to watch are 2757 – resistance to watch is 2776. If traders fail to break lower, we’ll begin to hold support and continue a bounce into congestion levels above. The bullets below represent the likely shift of trading momentum at the successful or failed retests at the levels noted.
- Buying pressure intraday will likely strengthen with a bullish retest of 2776.75
- Selling pressure intraday will likely strengthen with a bearish retest of 2757
- Resistance sits near 2778 to 2781.75, with 2784.5 and 2791.75 above that.
- Support sits between 2764.5 and 2761.75, with 2753.25 and 2748.75
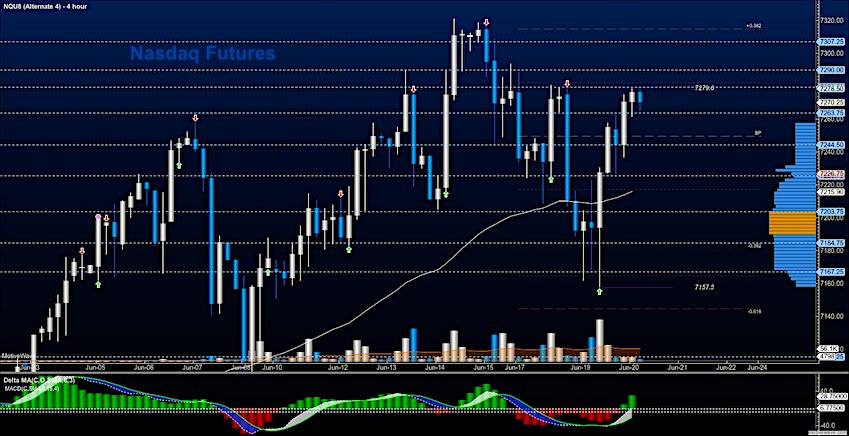
NASDAQ Futures
As suggested yesterday, support regions did test and hold in this very bullish market environment. However, lower resistance and lower support lines exist and this suggests that there is a lot of intraday market swing in a swath of crosscurrents. We’ll need to hold the week near 7224 as support to keep alive the overall upside pressure. Heavy congestion sits in a wide path between 7160 and 7260. The bullets below represent the likely shift of trading momentum at the successful or failed retests at the levels noted.
- Buying pressure intraday will likely strengthen with a bullish retest of 7278.75
- Selling pressure intraday will likely strengthen with a bearish retest of 7261.5
- Resistance sits near 7289.5 to 7301.25 with 7307.5 and 7316.5 above that.
- Support sits between 7252.5 and 7244.5, with 7236.5 and 7217 .75 below that.
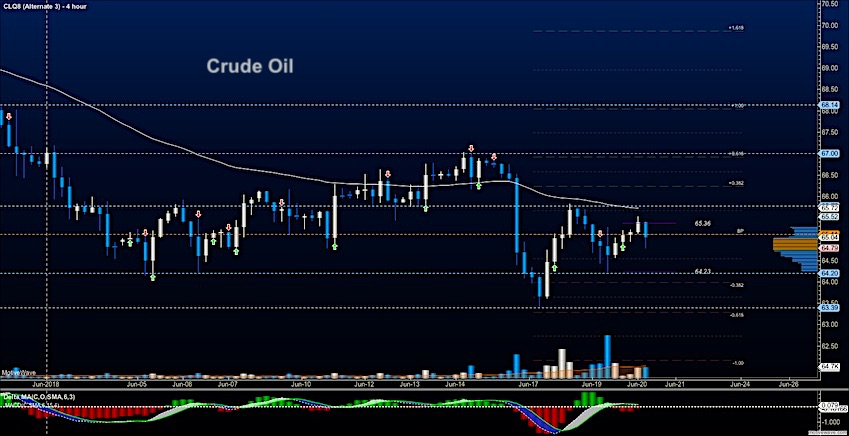
WTI Crude Oil
EIA report today at 10:30am. Traders have this chart rangebound in all the OPEC news surrounding Iran and such. Support action continues to be important to watch as buyers have once again lost the low but quickly come back to recover price. Any spikes we see due to the EIA release should reverse in this current environment. The bullets below represent the likely shift of trading momentum at the successful or failed retests at the levels noted.
- Buying pressure intraday will likely strengthen with a bullish retest of 65.56
- Selling pressure intraday will strengthen with a bearish retest of 64.74
- Resistance sits near 65.72 to 66.12, with 66.38 and 66.77 above that
- Support holds near 64.59 to 64.22, with 63.97 and 63.61 below that
Twitter: @AnneMarieTrades
The author trades stock market futures every day and may have a position in mentioned securities at the time of publication. Any opinions expressed herein are solely those of the author, and do not in any way represent the views or opinions of any other person or entity.


