Stock Market Futures Considerations For June 14, 2017
The S&P 500 (INDEXSP:.INX) is testing key price resistance today. Traders will need to be respectful of overhead levels and wait for confirmation. Also watch for higher lows on pullbacks.
Check out today’s economic calendar with a full rundown of releases. And note that the charts below are from our premium service at The Trading Book and are shared exclusively with See It Market readers.
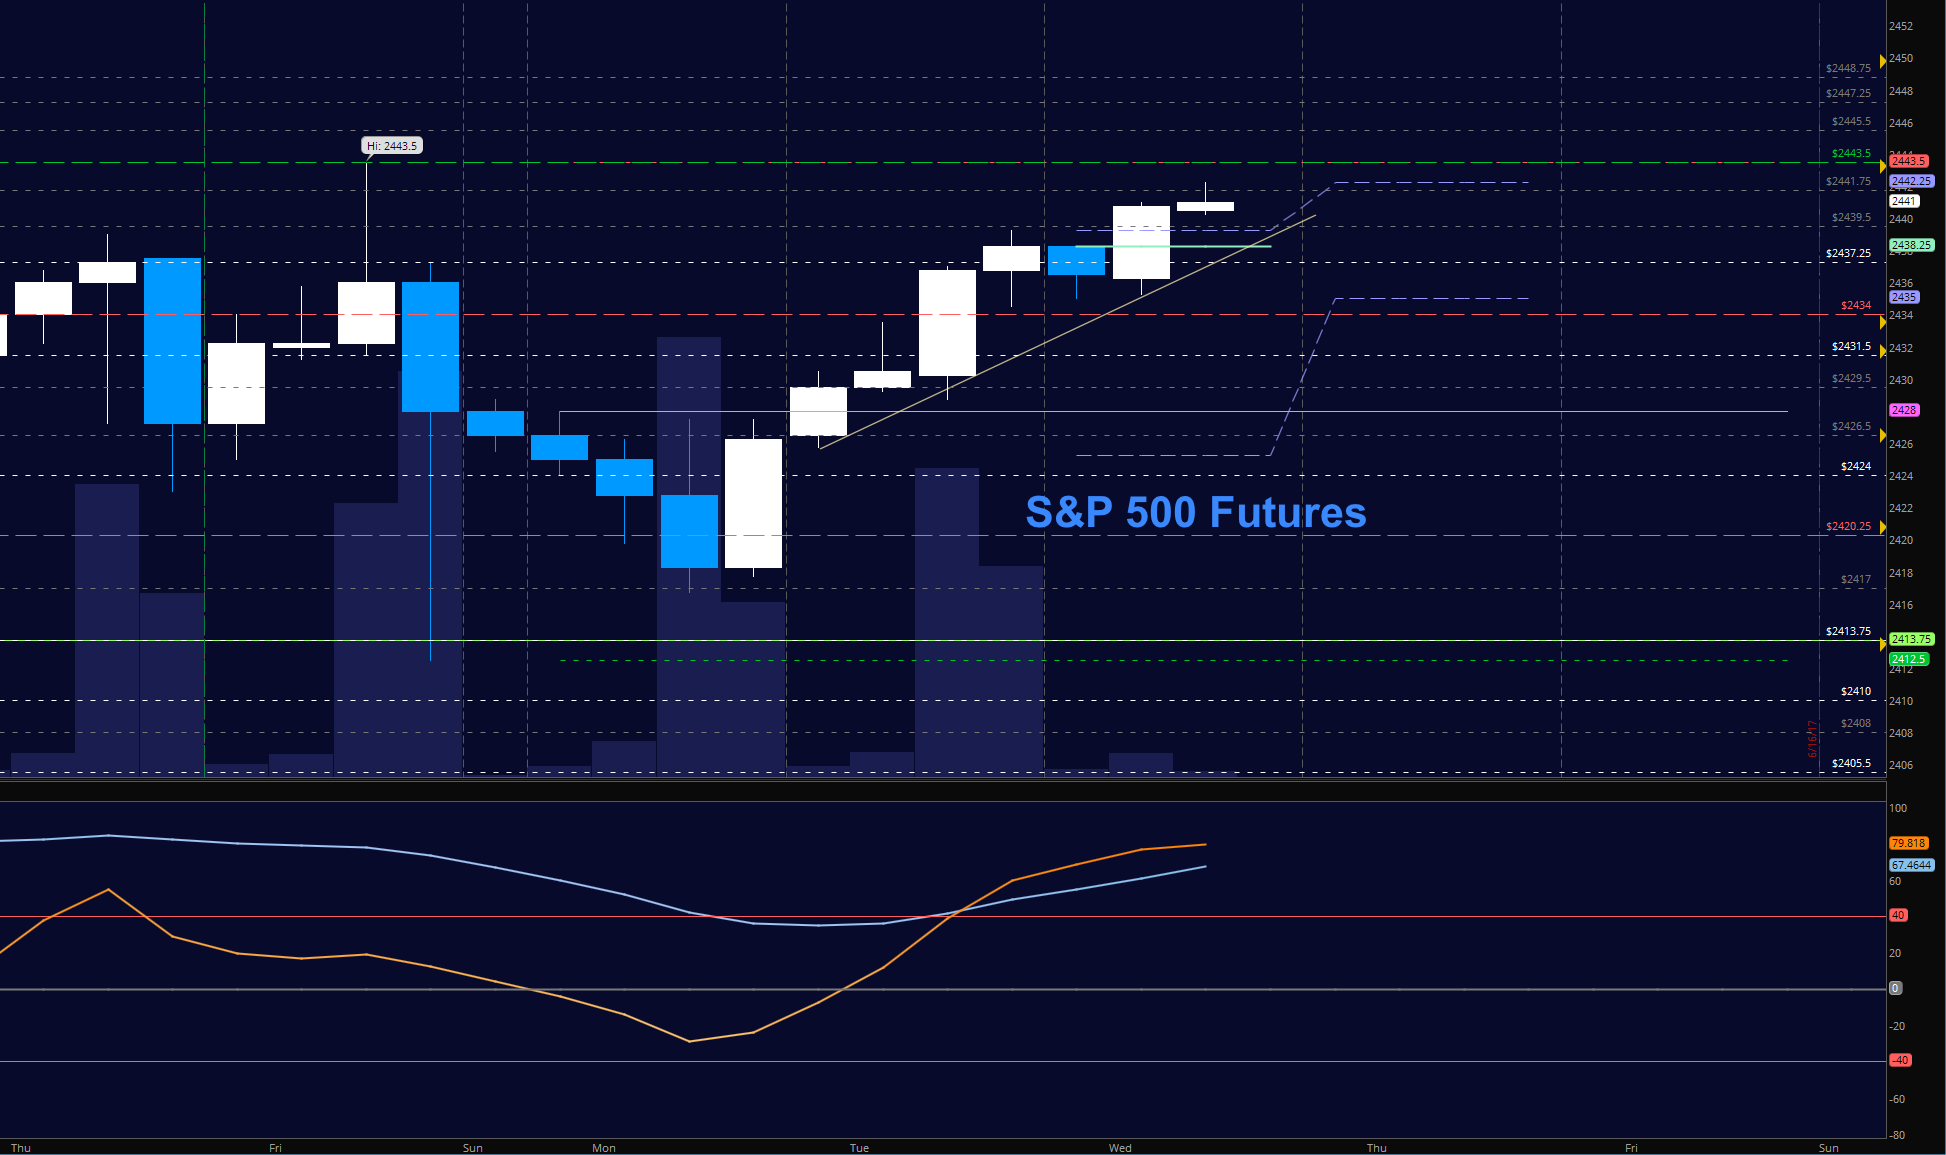
S&P 500 Futures (ES)
We are stretching into the test of old highs in the middle of this FOMC week. Support is now holding 2429 with resistance tests nearby. Breakouts seem likely with a run of stops ahead, and a fade to higher lows. The bullets below represent the likely shift of trading momentum at the positive or failed retests at the levels noted.
- Buying pressure intraday will likely strengthen above a positive retest of 2439.75
- Selling pressure intraday will likely strengthen with a failed retest of 2434
- Resistance sits near 2439.75 to 2441.75, with 2445.75 and 2449.5 above that.
- Support holds between 2434.5 and 2432.5, with 2428 and 2424 below that.
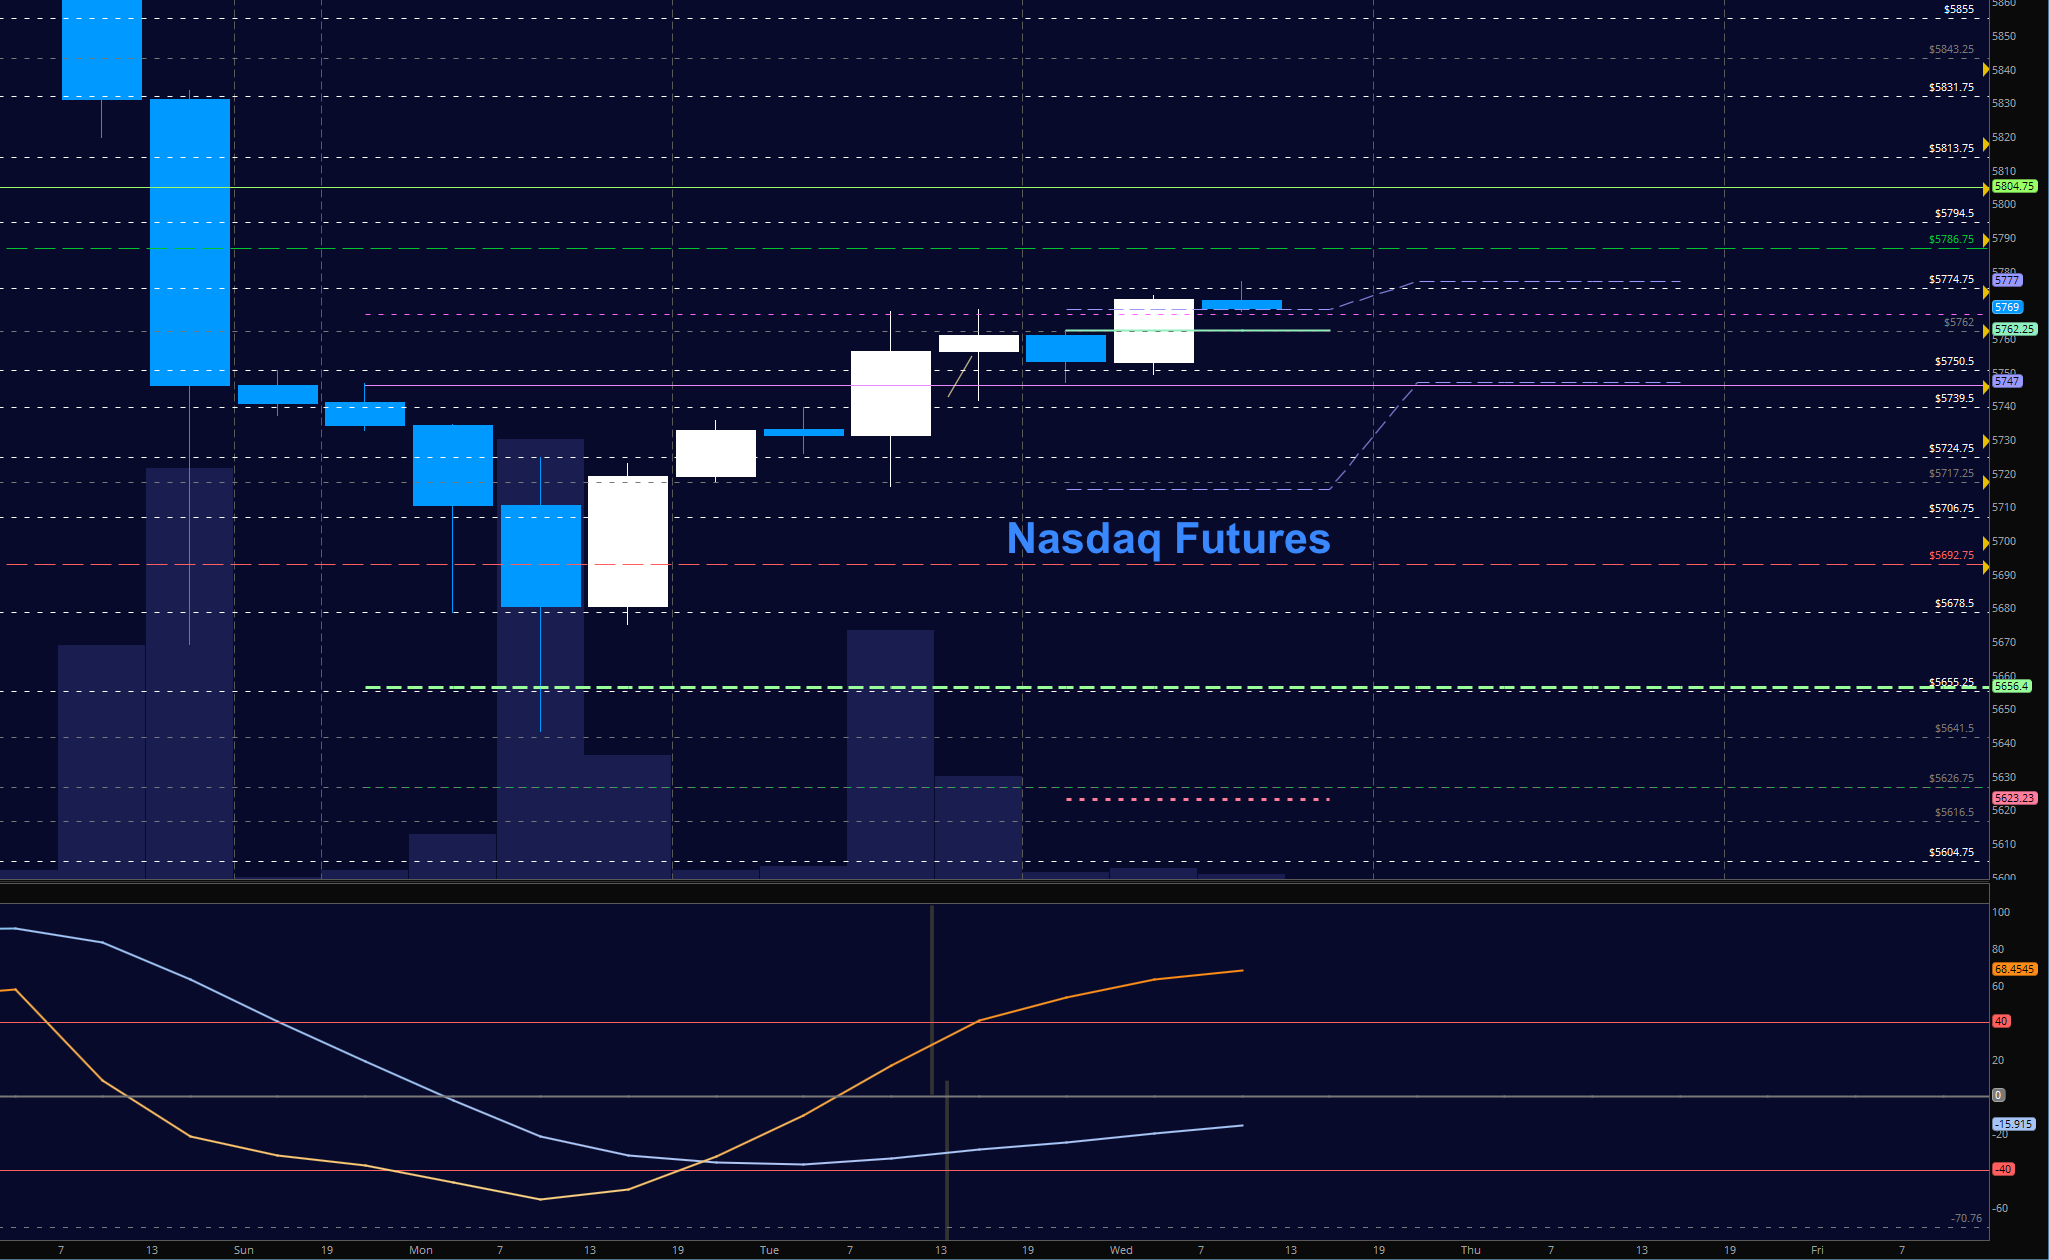
NASDAQ Futures (NQ)
The NQ_F is recovering at a much slower pace than the other indices – which could be a warning shot over the bow (the front part of the floating vessel for those wondering =) for the markets, or at least technology. Key resistance sits between 5774 and 5789. Support to hold is 5750 and above that is 5762. The bullets below represent the likely shift of intraday trading momentum at the positive or failed tests at the levels noted.
- Buying pressure intraday will likely strengthen with a positive retest of 5778
- Selling pressure intraday will likely strengthen with a failed retest of 5748
- Resistance sits near 5778 to 5789.5, with 5804.75 and 5831.5 above that.
- Support holds between 5750.25 and 5668.75, with 5645.5 and 5609.25 below that.
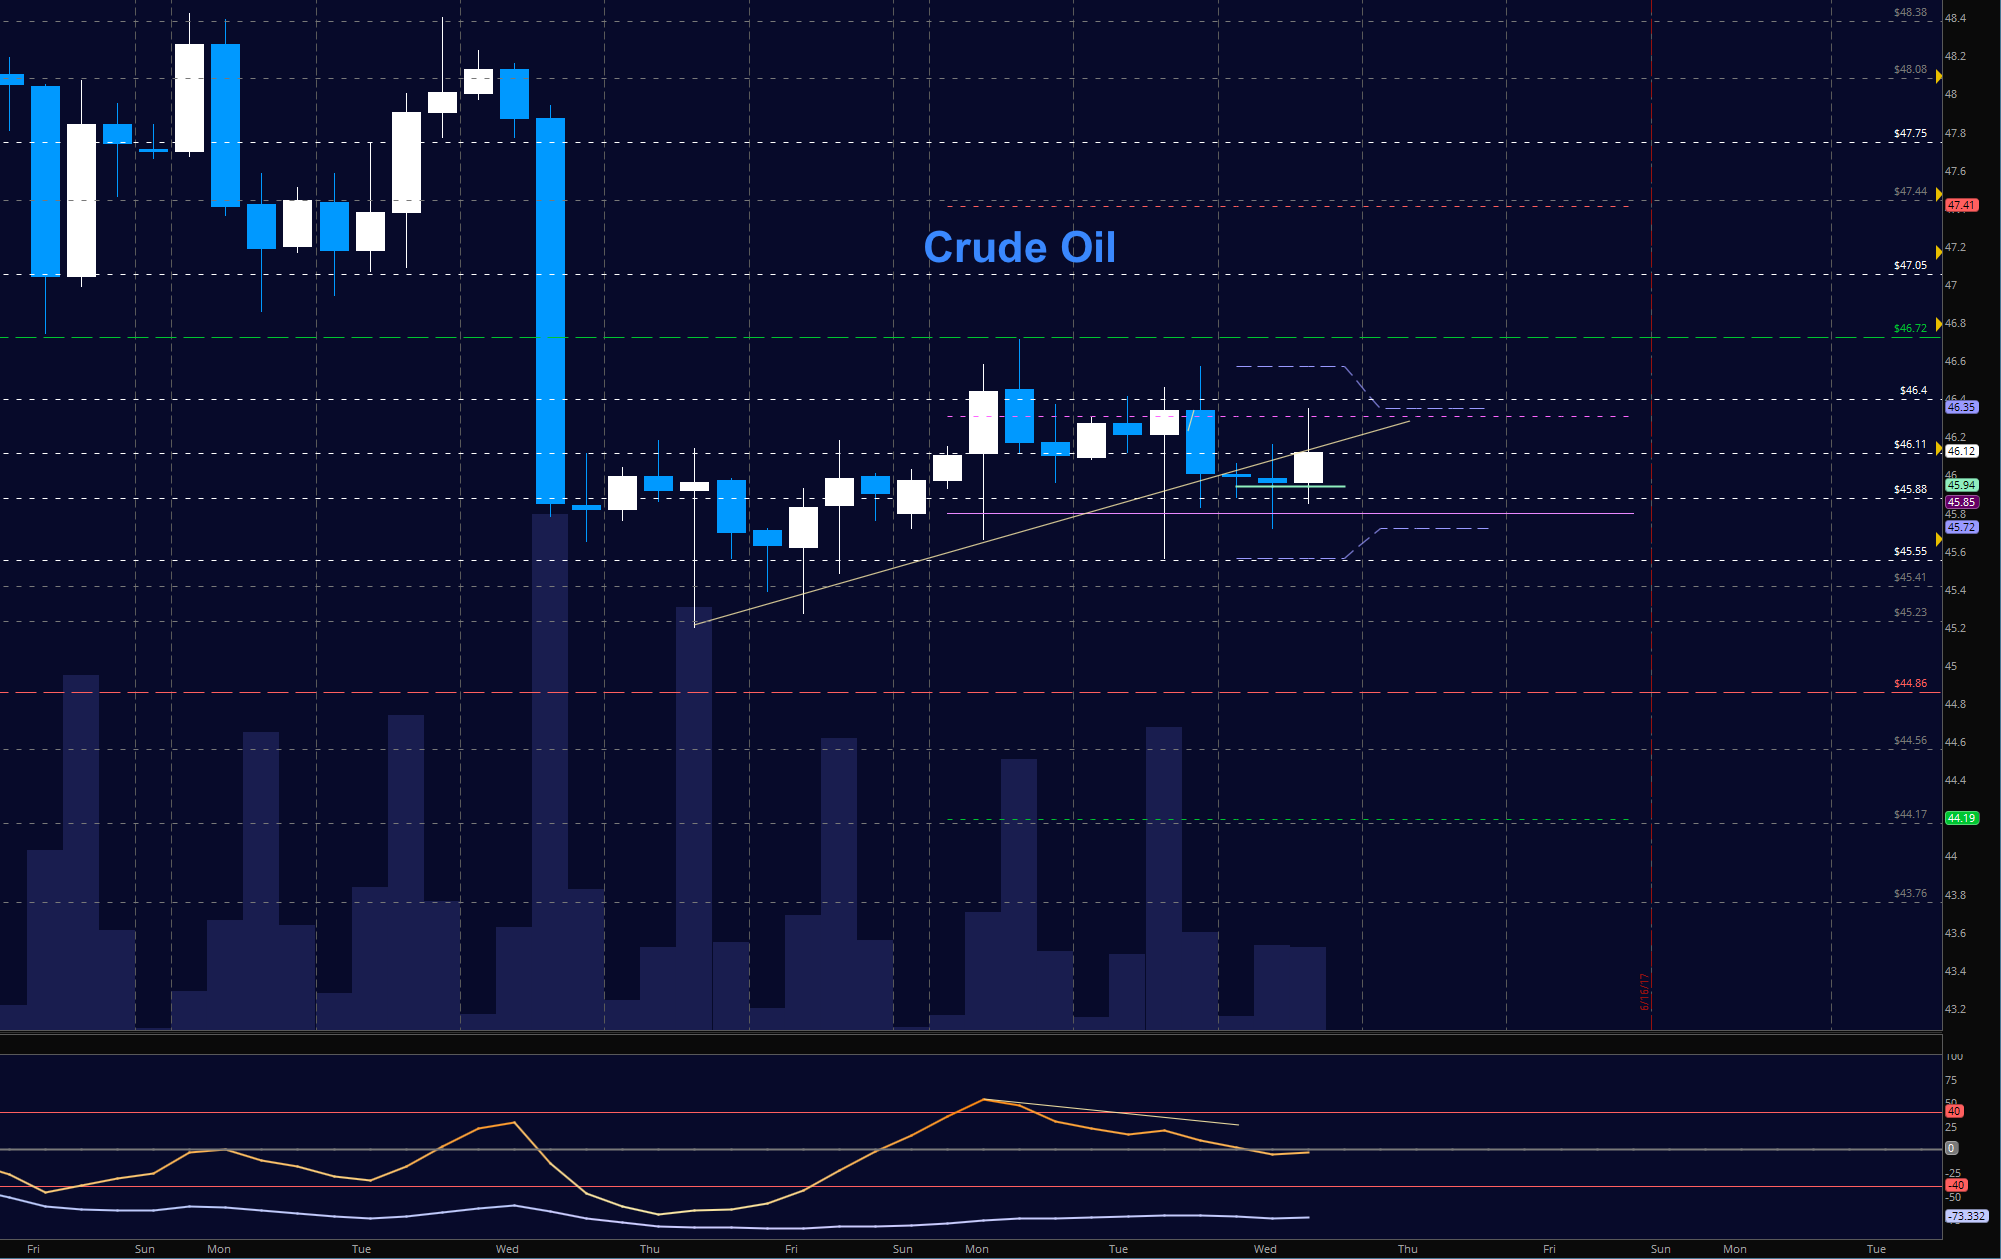
WTI Crude Oil
Congestion holds price bound between 45.5 and 46.72, with sellers now sitting near 46.4. EIA report is on the horizon. Momentum is mixed suggesting range bound trading setups are best. The bullets below represent the likely shift of trading momentum at the positive or failed tests at the levels noted.
- Buying pressure intraday will likely strengthen with a positive retest of 46.42
- Selling pressure intraday will strengthen with a failed retest of 45.7
- Resistance sits near 46.78 to 47.05, with 47.4 and 48.08 above that.
- Support holds between 45.57 to 45.27, with 44.86 and 44.46 below that.
Our live trading room is now primarily stock market futures content, though we do track heavily traded stocks and their likely daily trajectories as well – we begin at 9am with a morning report and likely chart movements along with trade setups for the day.
As long as the trader keeps himself aware of support and resistance levels, risk can be very adequately managed to play in either direction as bottom picking remains a behavior pattern that is developing with value buyers and speculative traders.
Twitter: @AnneMarieTrades
The author trades stock market futures every day and may have a position in mentioned securities at the time of publication. Any opinions expressed herein are solely those of the author, and do not in any way represent the views or opinions of any other person or entity.


