Stock Market Futures Considerations For June 12, 2017
Friday’s selloff tested breakout support for the S&P 500 (INDEXSP:.INX) and Nasdaq (INDEXNASDAQ:.IXIC) before bouncing. We are now testing the first level of resistance. What happens here may set the tone today.
Check out today’s economic calendar with a full rundown of releases. And note that the charts below are from our premium service at The Trading Book and are shared exclusively with See It Market readers.
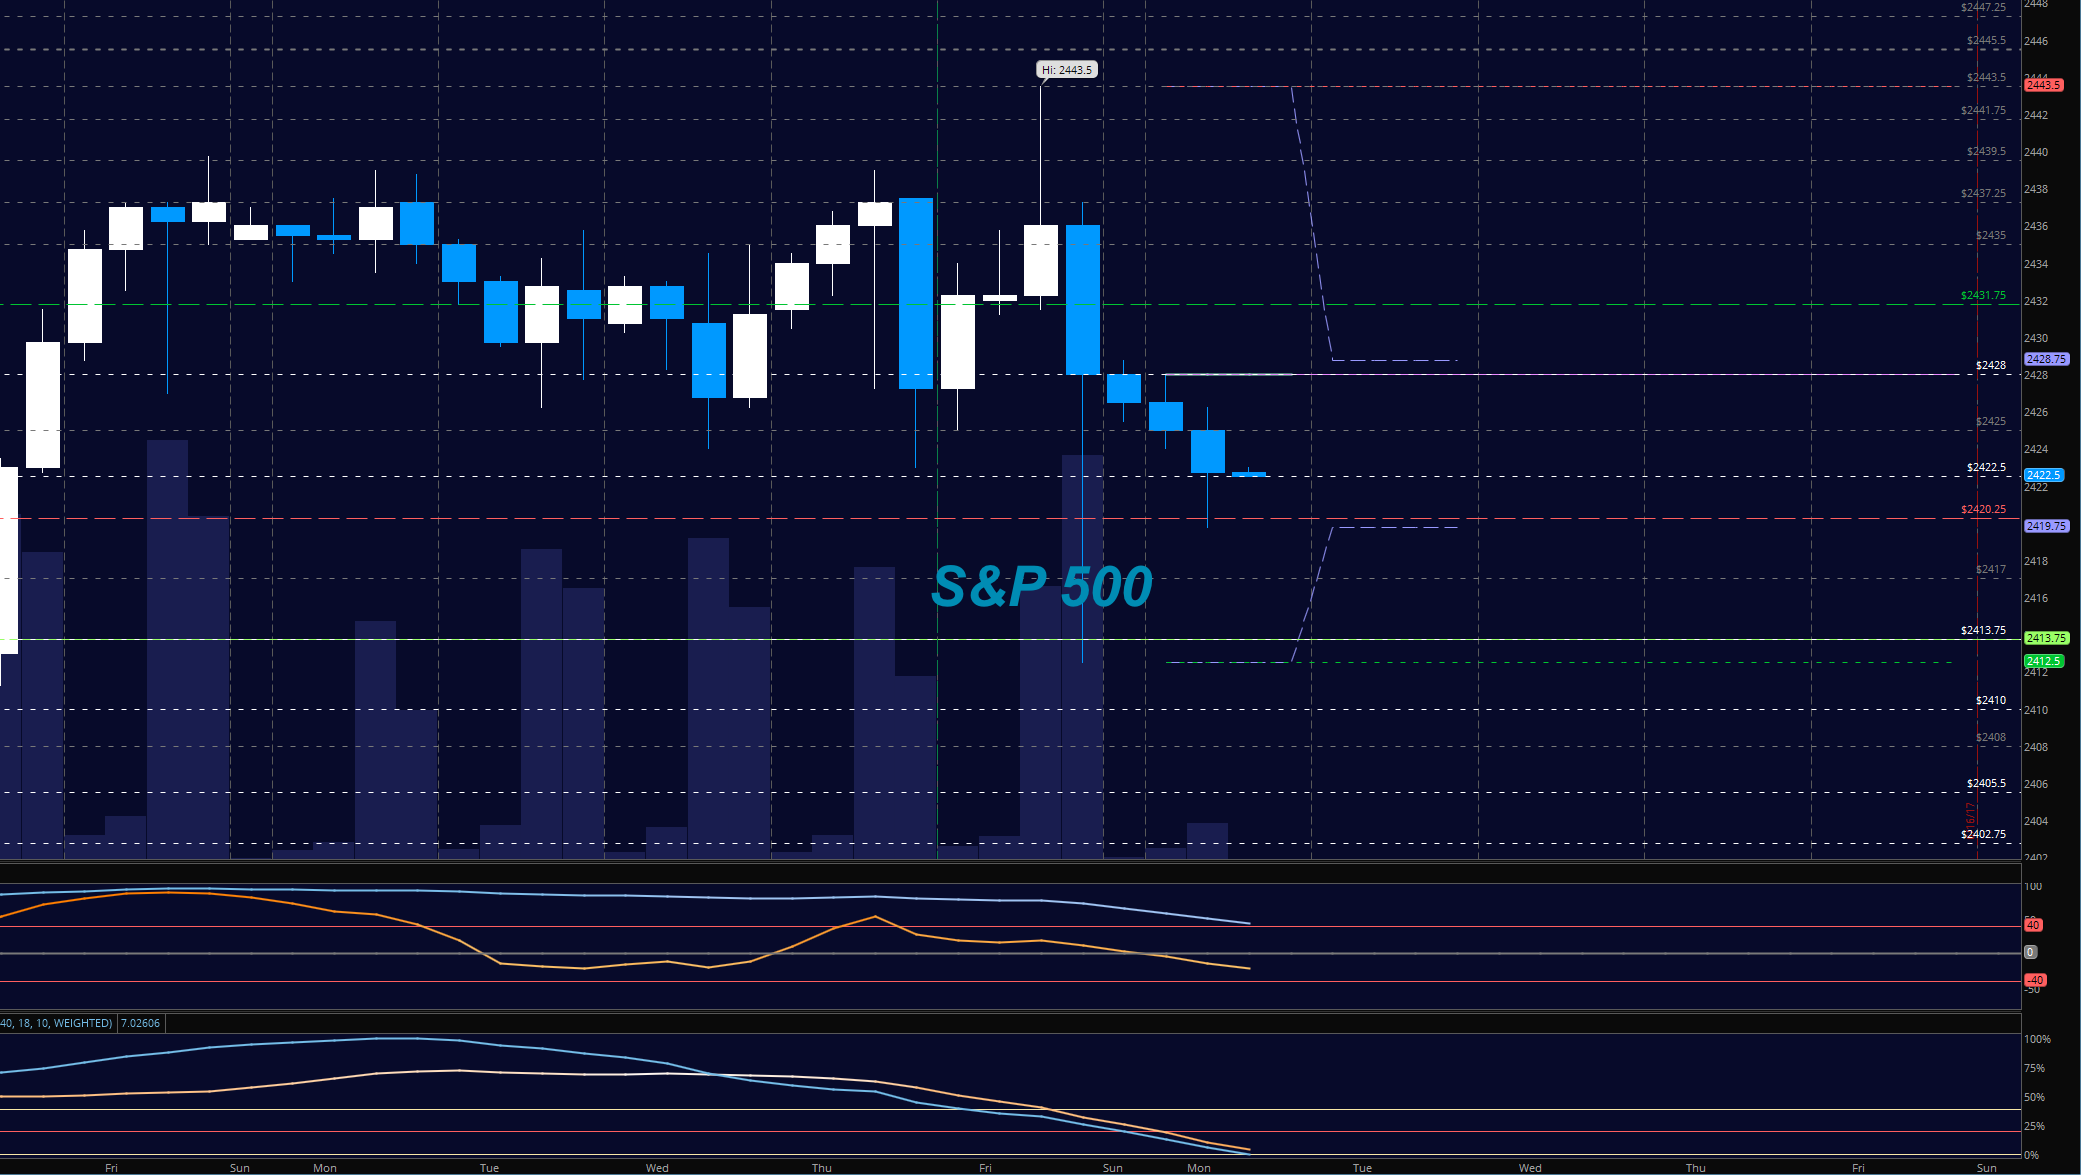
S&P 500 Futures (ES)
We are currently testing resistance at 2428.75. This area has been important support since last week’s breakout. Ranges may be tight if traders want to digest this move, else we may see continuation of shorting action. Longs are still likely to hold AT DEEPER SUPPORT – but the intraday motion and pressure is now decidedly negative. We tested the lowest edge of support noted on Friday’s post before staging a bounce. For those of us using HFT OTF signals from Hamzei Analytics, we could see early in the process what pressure was building downside. The bullets below represent the likely shift of trading momentum at the positive or failed retests at the levels noted.
- Buying pressure intraday will likely strengthen above a positive retest of 2431.75
- Selling pressure intraday will likely strengthen with a failed retest of 2419.75
- Resistance sits near 2434 to 2435.75, with 2437.75 and 2441.5 above that.
- Support holds between 2419.75 and 2413.5, with 2410.5 and 2407.75 below that.
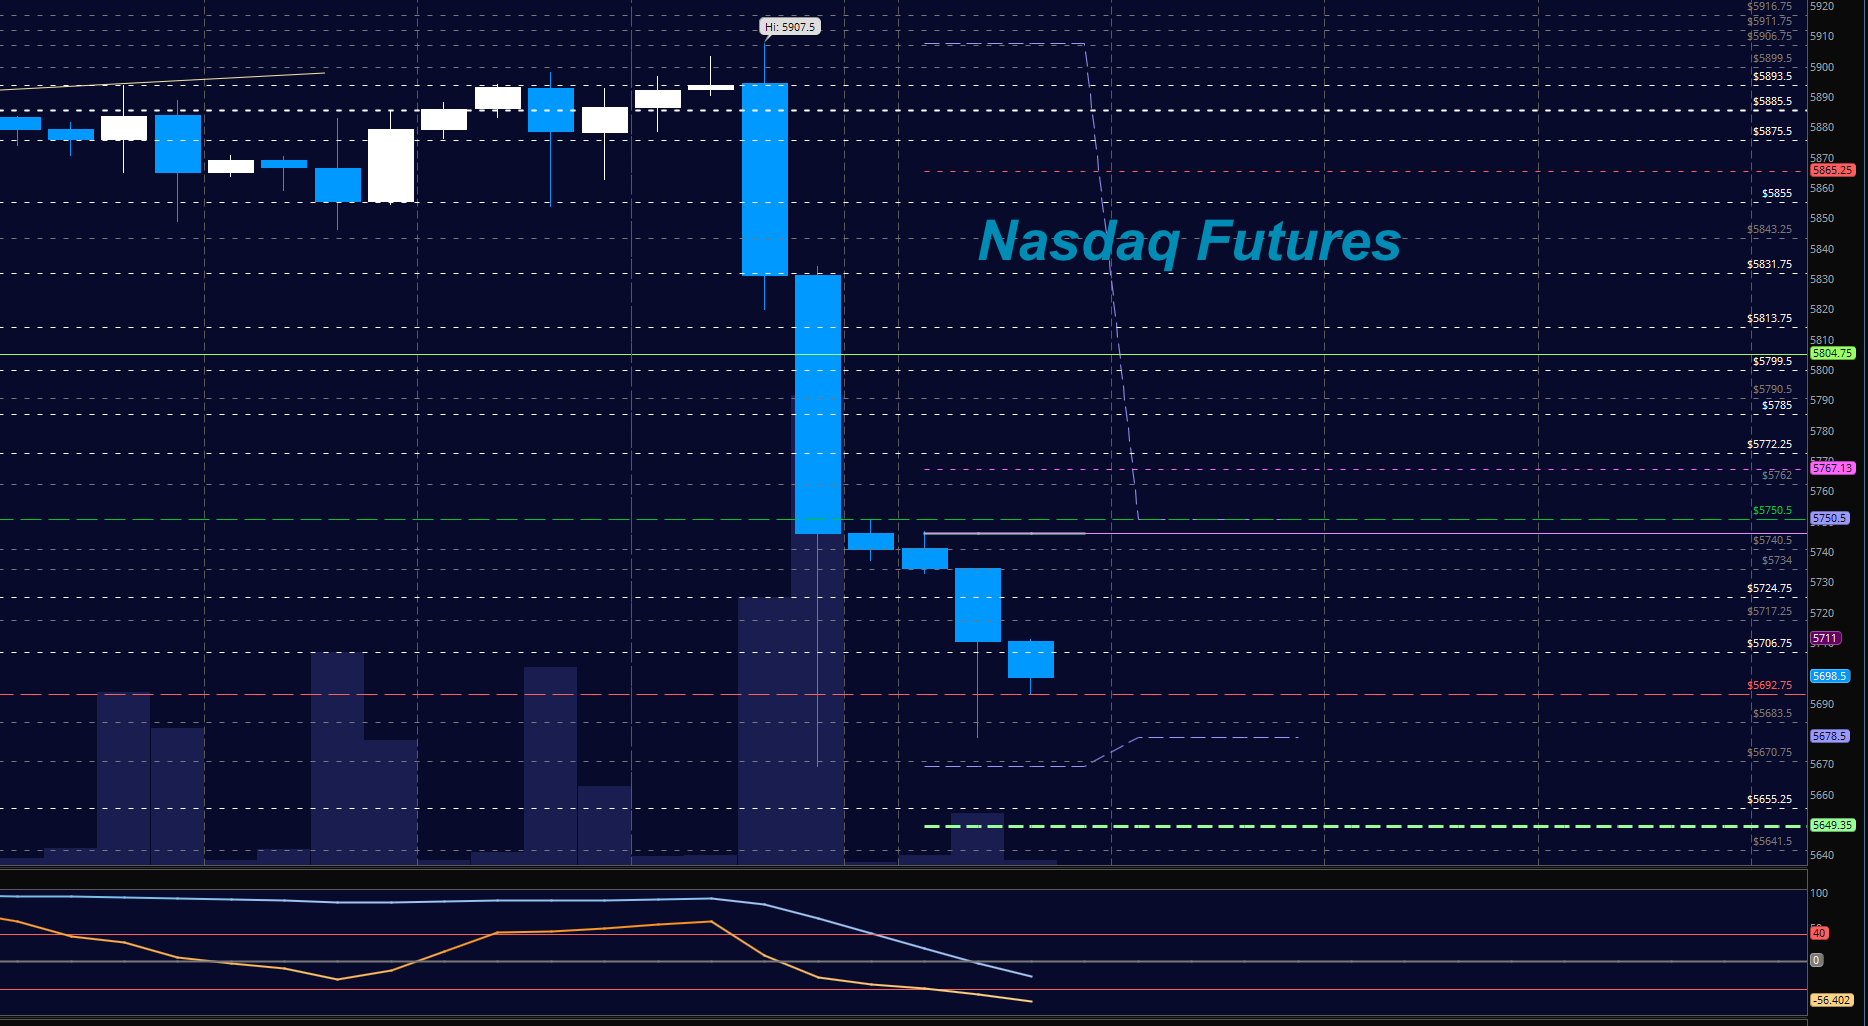
NASDAQ Futures (NQ)
This chart began selling early in the day on Friday and did not bounce until the test of weekly support levels near 5690. That will be the support zone to watch today as failure will bring more sellers to the front of the line with eyes on 5669 and 5653 as lower levels of deep support. The buyers will need to recapture a minimum of 5744 to 5762 to be winners of the current battle over the coming days. The bullets below represent the likely shift of intraday trading momentum at the positive or failed tests at the levels noted.
- Buying pressure intraday will likely strengthen with a positive retest of 5714.75
- Selling pressure intraday will likely strengthen with a failed retest of 5690
- Resistance sits near 5714.5 to 5734.75, with 5750.5 and 5762.5 above that.
- Support holds between 5690.25 and 5668.75, with 5645.5 and 5609.25 below that.
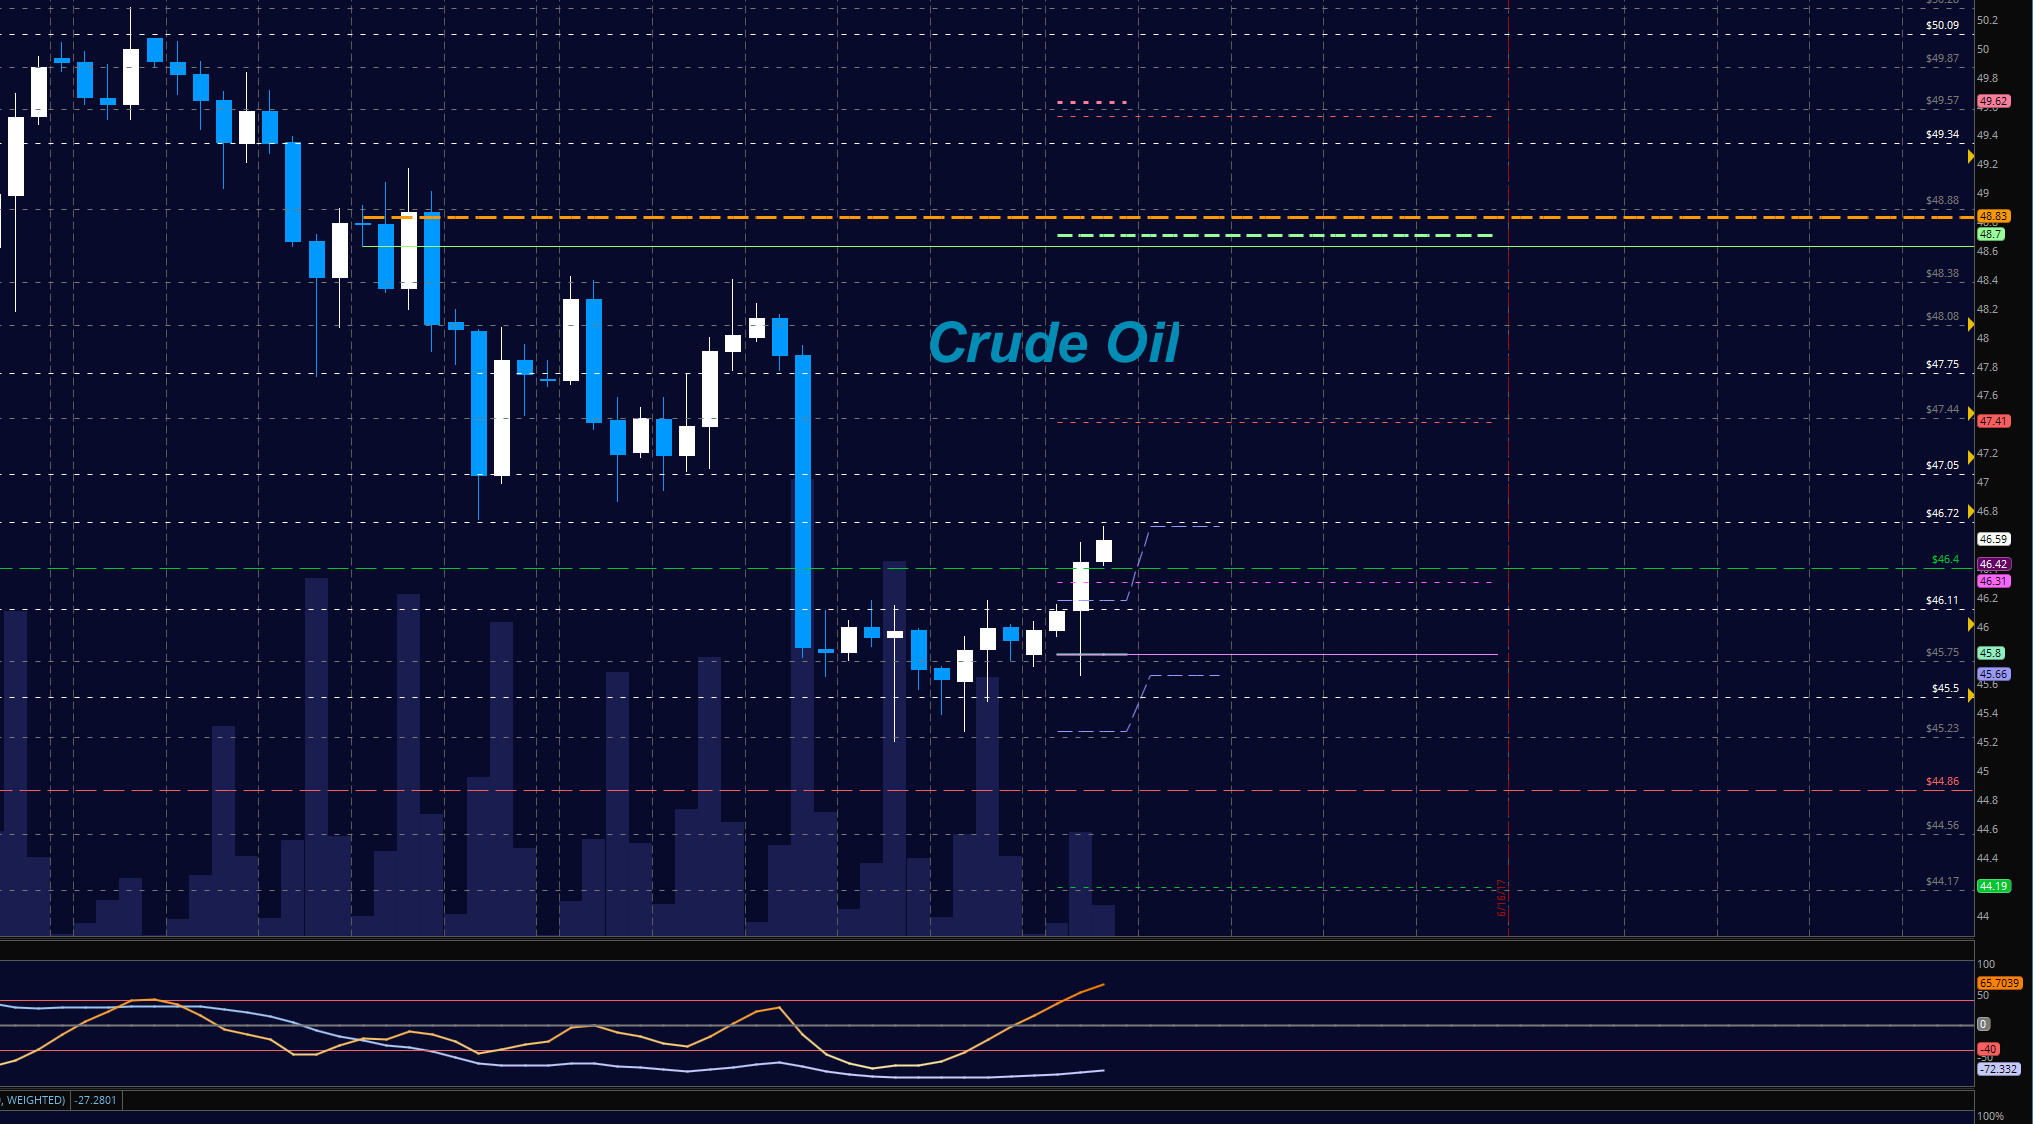
WTI Crude Oil
Reversal action is in play as prices try to stabilize near 45.5. We are attempting a test of the breakdown level near 47.05, but 46.78 looms as resistance. Support seems to hold for now near 45.2 and below that is 44.86. Momentum is mixed suggesting range bound trading setups are best. The bullets below represent the likely shift of trading momentum at the positive or failed tests at the levels noted.
- Buying pressure intraday will likely strengthen with a positive retest of 46.11
- Selling pressure intraday will strengthen with a failed retest of 45.42
- Resistance sits near 46.78 to 47.05, with 47.4 and 48.08 above that.
- Support holds between 45.42 to 45.05, with 44.86 and 44.56 below that.
Our live trading room is now primarily stock market futures content, though we do track heavily traded stocks and their likely daily trajectories as well – we begin at 9am with a morning report and likely chart movements along with trade setups for the day.
As long as the trader keeps himself aware of support and resistance levels, risk can be very adequately managed to play in either direction as bottom picking remains a behavior pattern that is developing with value buyers and speculative traders.
Twitter: @AnneMarieTrades
The author trades stock market futures every day and may have a position in mentioned securities at the time of publication. Any opinions expressed herein are solely those of the author, and do not in any way represent the views or opinions of any other person or entity.


 Ready To Break Out?")
