Broad Stock Market Futures Outlook for June 11, 2018
Trading is quiet and I suspect will be tentative all week as news rolls like thunder across the media streams over the airwaves. Bullish undercurrents will keep deep dips as buying zones but front lines of higher support, if broken, can yield big dips in the current uncertainty for traders.
As long as higher supports are held (noted below), we should have a quiet grinding upside day – else, we could easily dip sharply as volume profiles remain shallow.
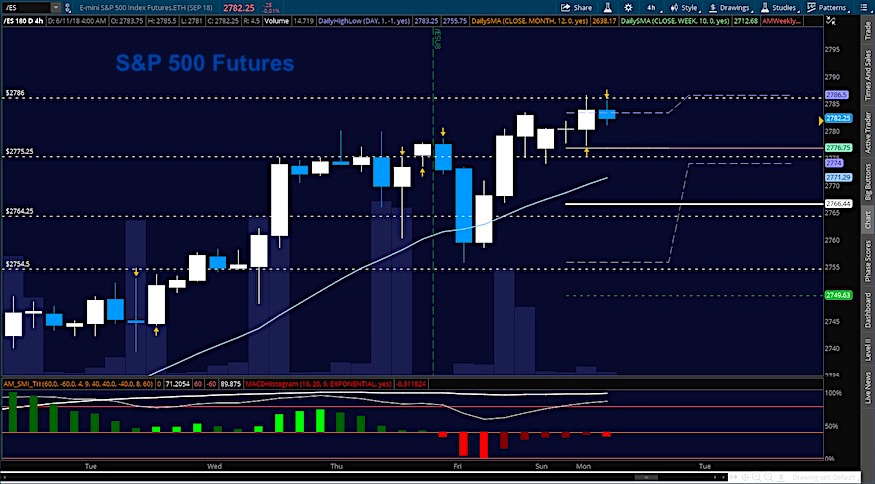
S&P 500 Futures
Intraday resistance and support levels are close to each other with 2781 being important to hold. First passes should find buyers but continued testing at this level will be a fair signal that we will break lower into deeper support levels. The bullets below represent the likely shift of trading momentum at the successful or failed retests at the levels noted.
- Buying pressure intraday will likely strengthen with a bullish retest of 2786.50
- Selling pressure intraday will likely strengthen with a bearish retest of 2780.5
- Resistance sits near 2784.5 to 2791.75, with 2794.75 and 2806.75 above that
- Support sits between 2781.25 and 2776.75, with 2767.25 and 2749.75
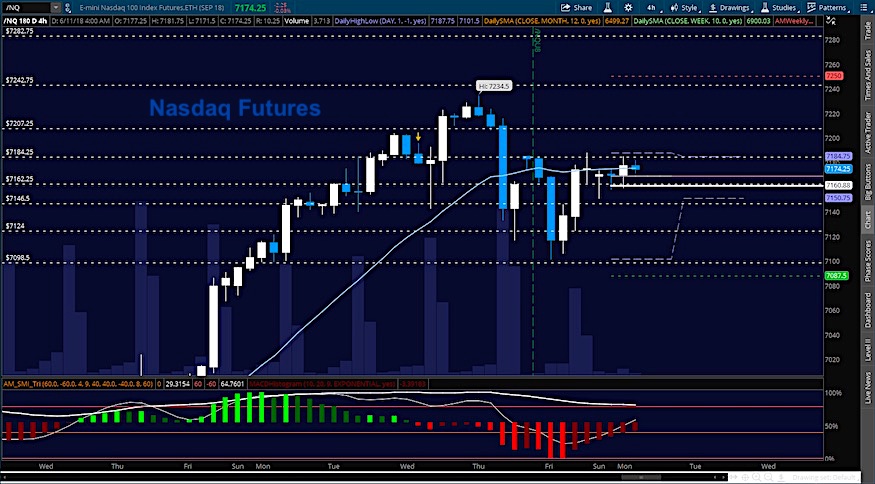
NASDAQ Futures
Highs faded quietly from last week as support sits weakly at 7149. Formations are bullish on larger time frames so deep dips remain buying opportunities. The failure to hold above our support near 7149 will shift the balance of power to sellers intraday. The bullets below represent the likely shift of trading momentum at the successful or failed retests at the levels noted.
- Buying pressure intraday will likely strengthen with a bullish retest of 7187.5
- Selling pressure intraday will likely strengthen with a bearish retest of 7147.5
- Resistance sits near 7182.75 to 7206.25 with 7226.5 and 7257.5 above that.
- Support sits between 7150.5 and 7126.5, with 7087.75 and 7048 .75 below that.
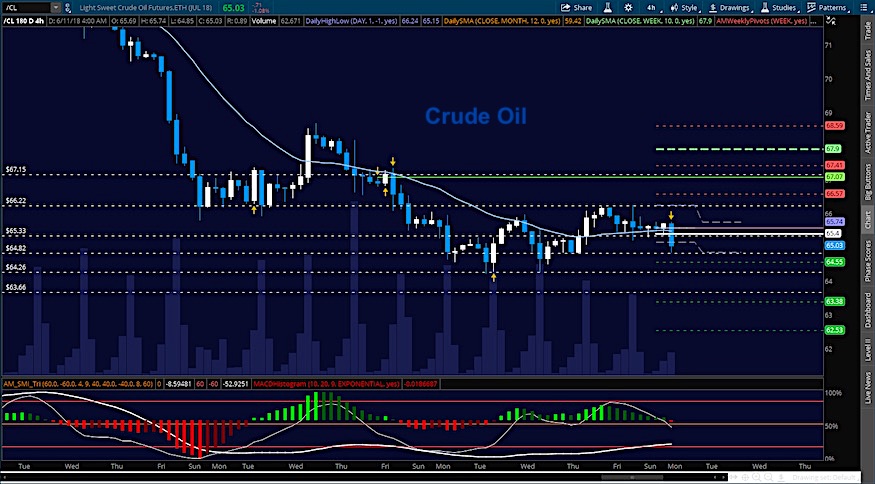
WTI Crude Oil
Traders are continuing a bottoming formation and holding support near 65. Rangebound but with greater signs of weakness, the charts are giving us mixed messages about price flow, so if support breaks here, we can easily head quite a bit lower. The bullets below represent the likely shift of trading momentum at the successful or failed retests at the levels noted.
- Buying pressure intraday will likely strengthen with a bullish retest of 65.76
- Selling pressure intraday will strengthen with a bearish retest of 64.84
- Resistance sits near 65.64 to 66.12, with 66.47 and 66.87 above that.
- Support holds near 65.04 to 64.84, with 64.27 and 63.46 below that.
You can learn more about trading and our memberships HERE.
Twitter: @AnneMarieTrades
The author trades stock market futures every day and may have a position in mentioned securities at the time of publication. Any opinions expressed herein are solely those of the author, and do not in any way represent the views or opinions of any other person or entity.
: Creating Bullish Divergence?")


 and Semiconductors (SMH): Concerning Price Pattern?")


