Outlook for July 20, 2016 –
Stock market futures are heading higher this morning which should lead to a higher open for the S&P 500 Index (INDEXSP:.INX). Earlier this week S&P 500 futures saw a few bounces fail before finally bouncing off lower support and rallying. It tested 2167.25 this morning, just shy of that 2167.75 resistance mentioned yesterday. Price support to watch below is still 2151, but the overnight low is higher at 2155. Below that, we see 2145.5 and 2139.5. Resistance above sits near 2167.75 to 2179.75.
See today’s economic calendar with a rundown of releases.
RANGE OF TODAY’S MOTION
S&P 500 Futures July 20 – Trading Chart (ES_F)
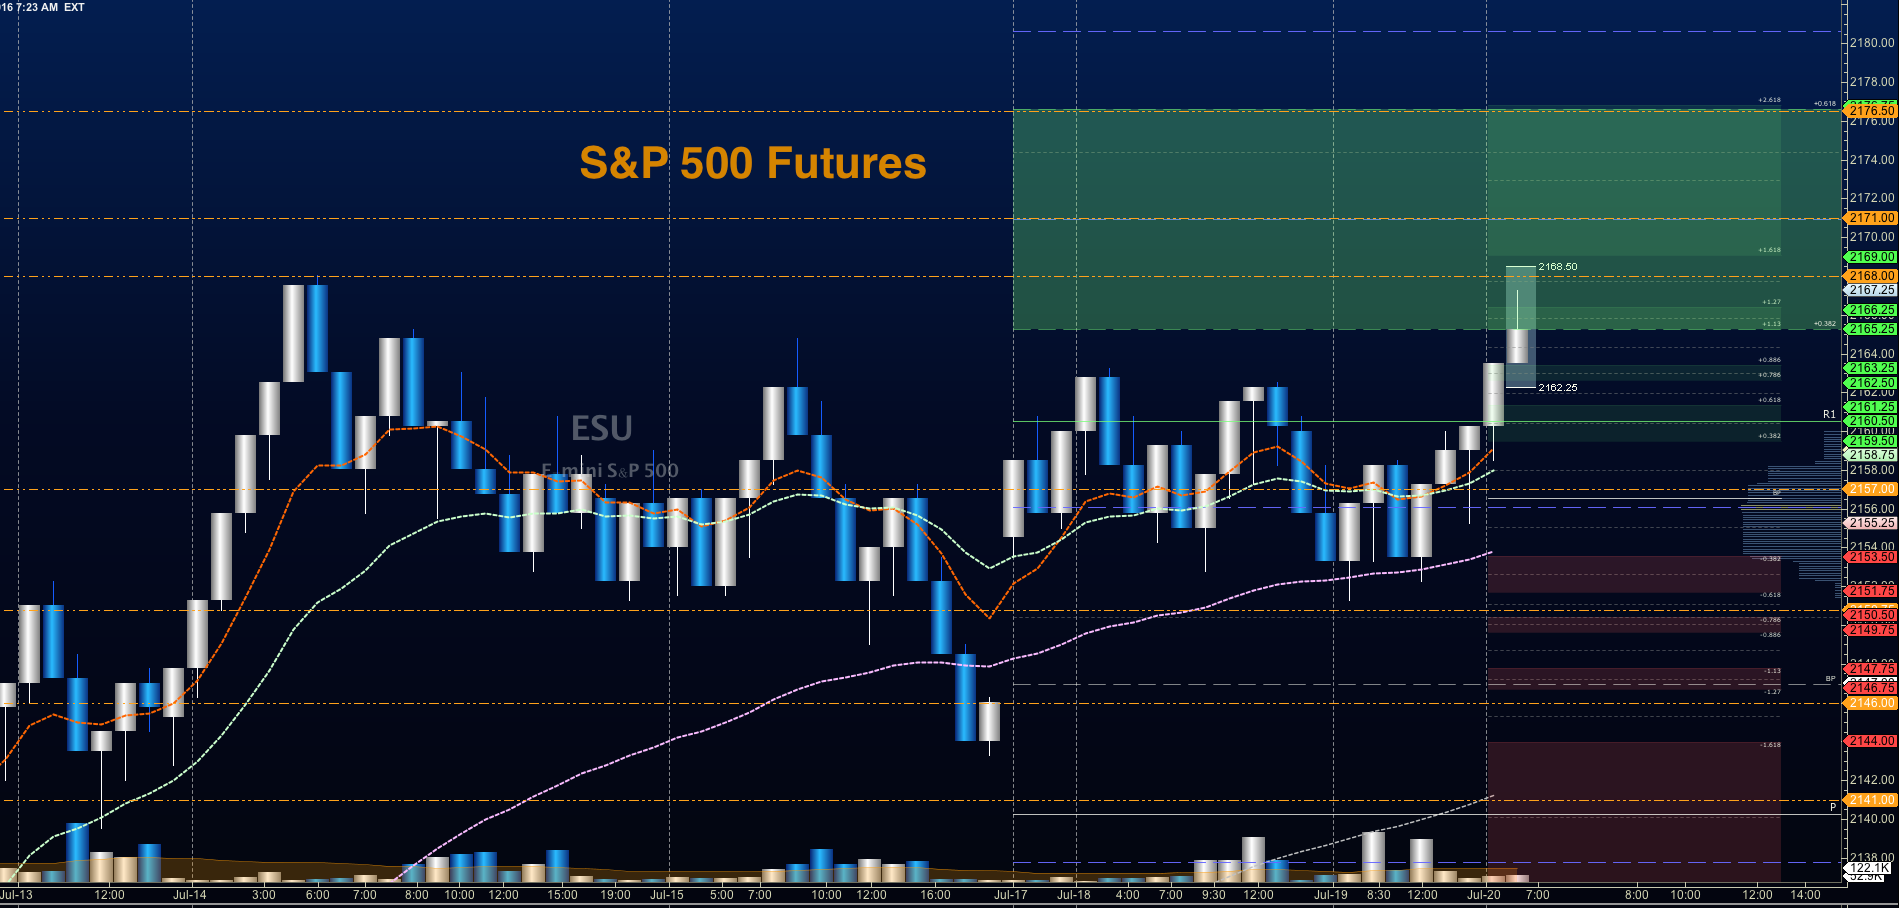
Upside trades on S&P 500 futures – Favorable setups sit on the positive retest of 2161.5, or a positive retest of the bounce off 2158.5 with positive momentum. Keep an eye out for lower highs to set in, as this could signal that sellers are collecting strength. I use the 30min to 1hr chart for the breach and retest mechanic. Targets from 2158.5 are 2161.5, 2163.25, 2167.5, 2171.5, 2175.75, 2179.25, and if we expand, we may stretch above into 2181.75.
Downside trades on S&P 500 futures – Favorable setups sit below the failed retest of 2155 or at the first failed retest of 2160.5 with negative divergence. As this is still a countertrend trade keep your eyes on the lookout for higher lows developing intraday. Retracement into lower levels from 2160.5 gives us the targets 2157.75, 2155.5, 2151.5, 2147.75, 2145.75, 2143, 2141.75, 2138.75, 2136.5, 2134.5, 2128.25, 2124.5, 2122.75, and 2120.75 to 2118.5, if sellers take over.
If you’re interested in watching these trades go live, join us in the live trading room from 9am to 11:30am each trading day.
Nasdaq Futures (NQ_F)
Nasdaq Futures continue their range bound activity with price resistance above near 4628.75, and support near 4594, with a lower break into 4578.75, if sellers gain traction. The chart is extremely congested near the 4604 region.
Upside trades on Nasdaq futures – Favorable setups sit on the positive retest of 4621.5, or a positive retest of 4608.75 with positive momentum. I use the 30min to 1hr chart for the breach and retest mechanic. Watch for the lower high to develop near 4624.5, if sellers exercise more power intraday with lower tests of support. Targets from 4608.75 are 4611.25, 4618.75, 4626.75, 4629.25, 4633, and 4637.5 if buyers continue the rally north. Price is likely to retreat to support at these higher levels, so be careful, and if you like trading the edges, a countertrend short could open up here.
Downside trades on Nasdaq futures – Favorable setups sit below the failed retest of 4618, or at the failed retest of 4627.5 with negative divergence. Watch those moving averages and trend lines when taking the shorts. Retracement into lower levels from 4627.5 gives us the targets 4624, 4621, 4618.75, 4615.75, 4614, 4611.25, 4606.75, 4598.75, 4592.5, 4585.5, 4580.75, 4576.75, 4574.75, 4571.5, 4568.25, 4566.5, 4563.75, 4561.75, and 4557 to 4552.75, if sellers resume control.
Crude Oil
The support level for oil near 45.5 was broken, but traders are keeping the chart in a new lower range heading into the EIA report. The API report was mixed, but off the target so there is a wait state for the EIA to come in. Momentum is negative, but a surprise number could bring traders into a long trade into resistance.
Trading ranges on crude oil begin today between 44.7 to 45.9.
Upside trades on crude oil futures can be staged on the positive retest of 45.72, or at a bounce off 45.24 with positive momentum. I often use the 30min to 1hr chart for the breach and retest mechanic. Targets from 45.24 are 45.45, 45.64, 45.72, 45.89, 46.04, 46.23, 46.48, 46.68, 46.82, 47.04, 47.32, 47.56, 47.78, and 48.14; if traders try once again to recapture 48.
Downside trades on crude oil futures can be staged on the failed retest of 45.42, or at the failed retest of 46.84 with negative divergence. Targets from 46.84 are 46.64, 46.37, 46.14, 46.06, 45.93, 45.73, 45.53, 45.39, 45.18, 44.96, 44.67, 44.48, 44.29, 44.16, 44.02, 43.84, and 43.65, if selling really takes hold.
If you’re interested in the live trading room, it is now primarily stock market futures content, though we do track heavily traded stocks and their likely daily trajectories as well – we begin at 9am with a morning report and likely chart movements along with trade setups for the day.
As long as the trader keeps himself aware of support and resistance levels, risk can be very adequately managed to play in either direction as bottom picking remains a behavior pattern that is developing with value buyers and speculative traders.
Twitter: @AnneMarieTrades
The author trades stock market futures every day and may have a position in mentioned securities at the time of publication. Any opinions expressed herein are solely those of the author, and do not in any way represent the views or opinions of any other person or entity.


