Stock Market Futures Considerations For July 12, 2017
The broader market is perking up this morning and looking to push past resistance. The S&P 500 (INDEXSP:.INX) is looking to breakout over 2432. Charts with key futures trading levels for S&P 500, Nasdaq, and Crude oil are below.
Check out today’s economic calendar with a full rundown of releases. And note that the charts below are from our premium service and shared exclusively with See It Market readers.
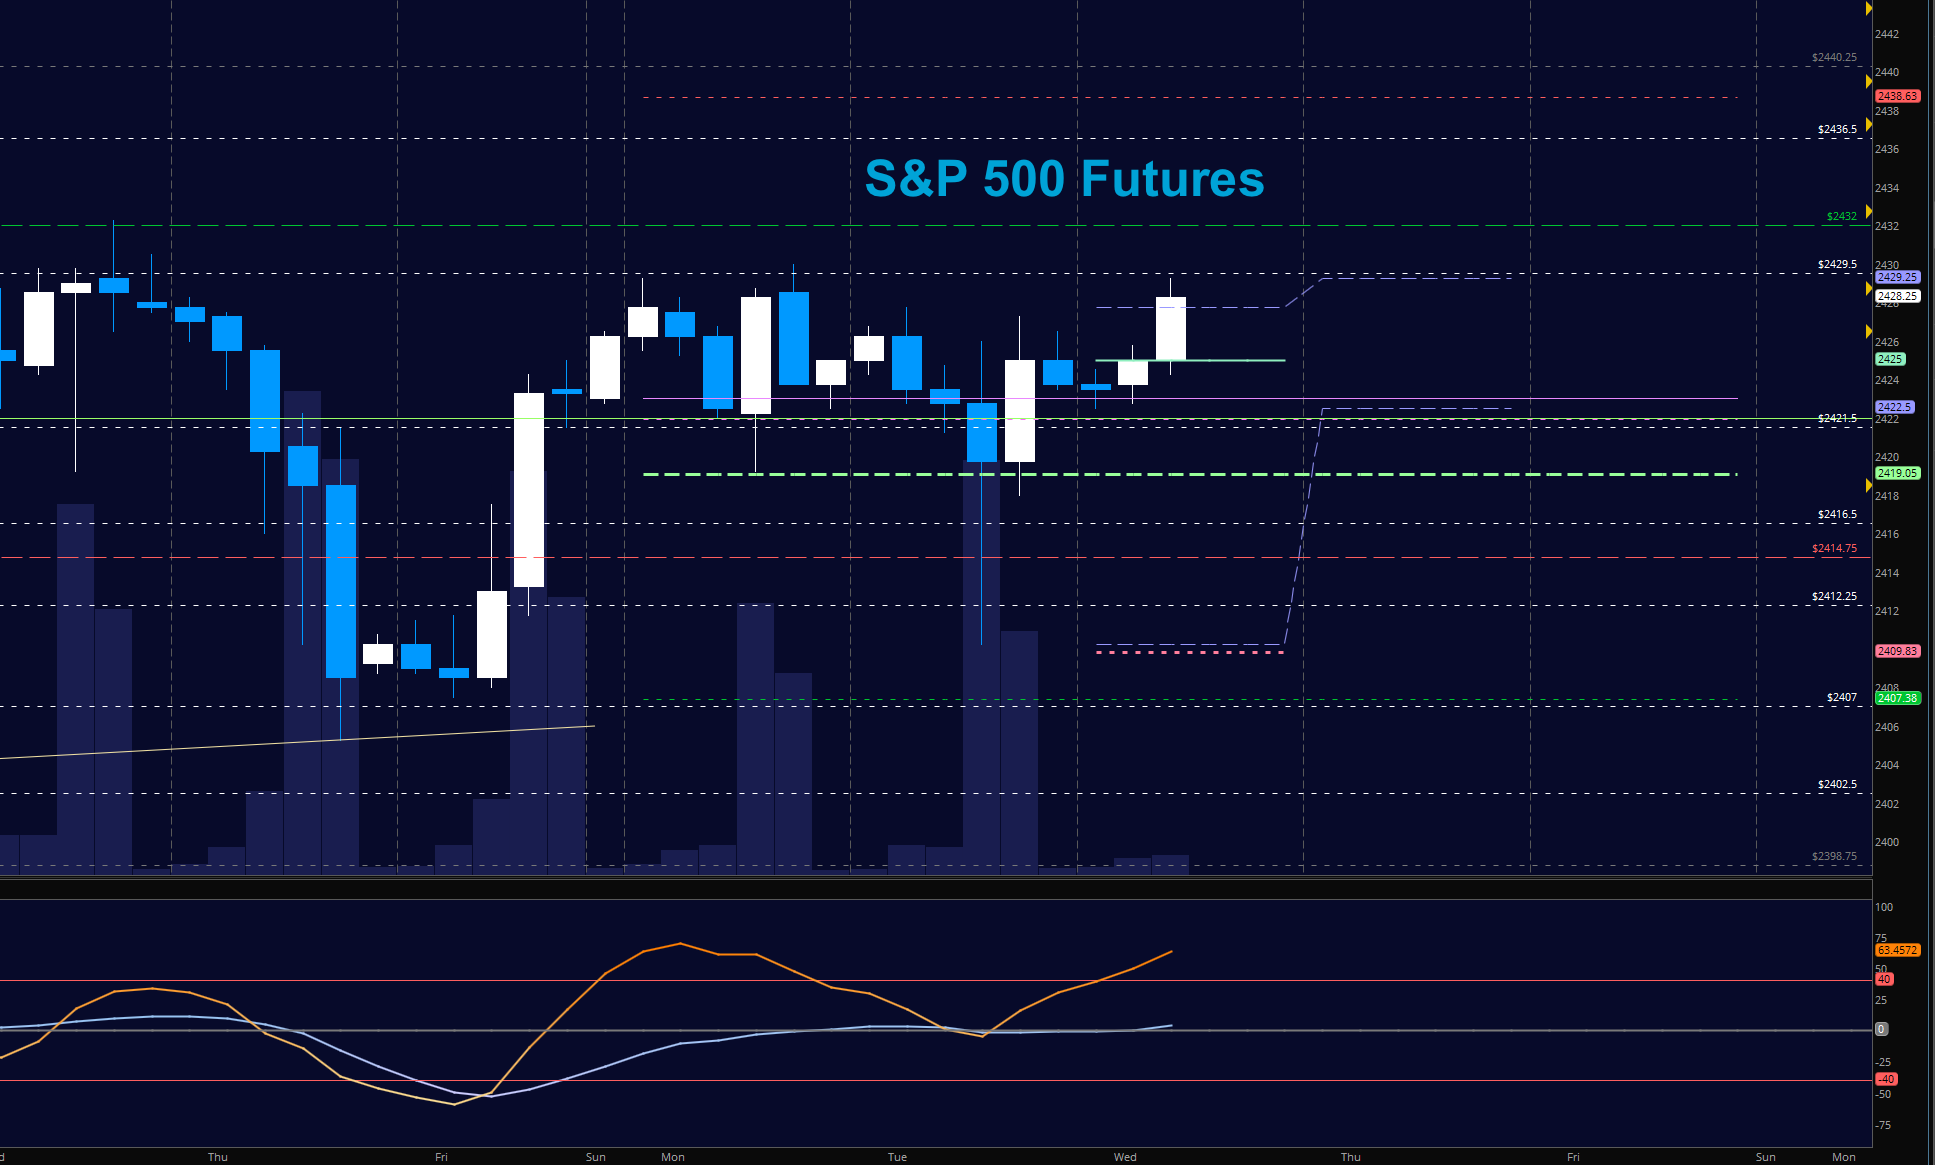
S&P 500 Futures (ES)
Traders seem to want to press resistance higher this morning across the board, Resistance remains at the familiar 2432, but that could easily be breached under the current environment. Momentum is beginning to lift, but breakouts to destinations will fade to higher lows. The bullets below represent the likely shift of trading momentum at the positive or failed retests at the levels noted.
- Buying pressure intraday will likely strengthen above a positive retest of 2430.
- Selling pressure intraday will likely strengthen with a failed retest of 2420
- Resistance sits near 2429.5 to 2432.5, with 2446.5 and 2448.5 above that.
- Support holds between 2420.5 and 2412.25, with 2408 and 2402.5 below that.
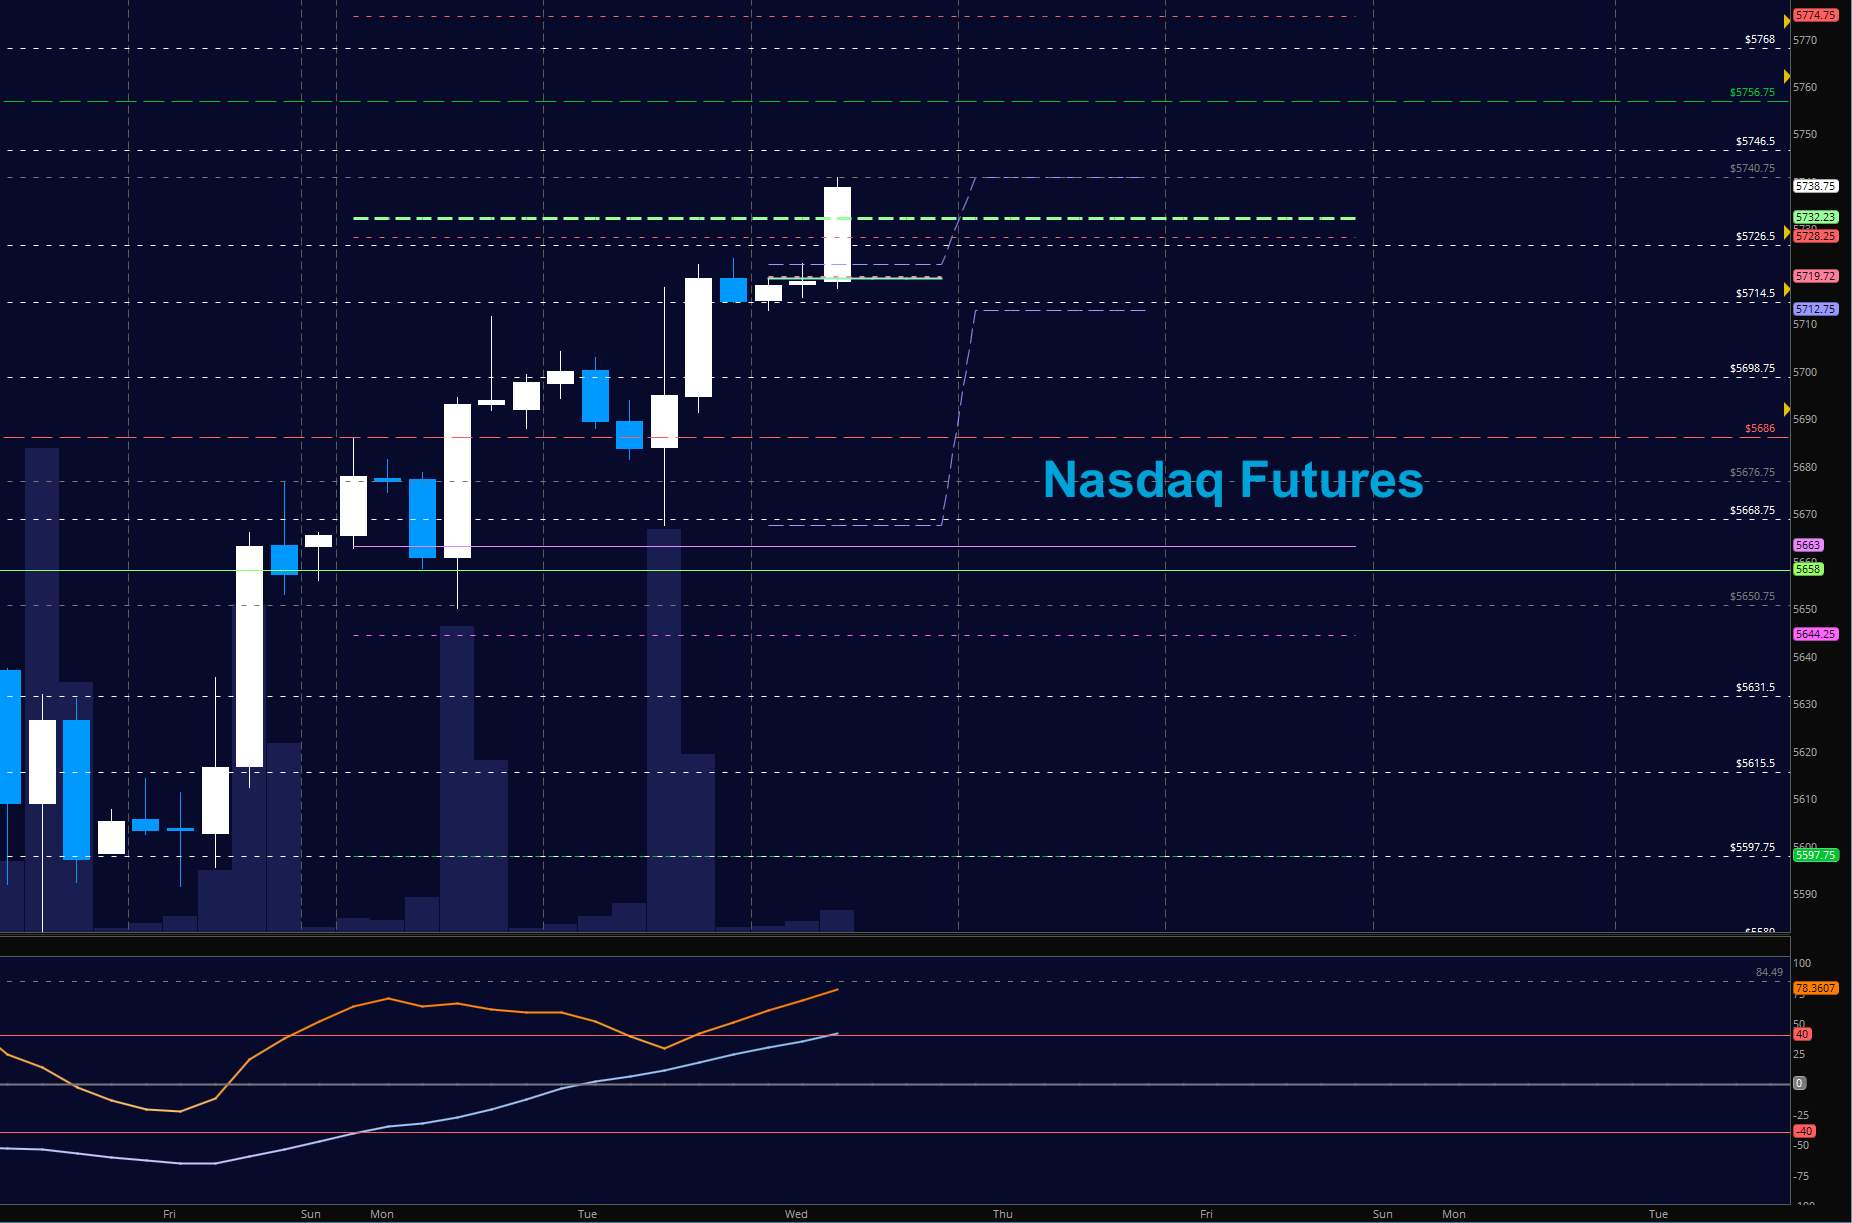
NASDAQ Futures (NQ)
Another nice move upward yesterday in an effort to recover lost levels from 6/28/17. Support rises to 5691 and resistance moves to 5741 and 5757 above. The bullets below represent the likely shift of intraday trading momentum at the positive or failed tests at the levels noted.
- Buying pressure intraday will likely strengthen with a positive retest of 5741.5
- Selling pressure intraday will likely strengthen with a failed retest of 5690
- Resistance sits near 5741.5 to 5757.25, with 5765 and 5774.75 above that.
- Support holds between 5691 and 5664.5, with 5644.5 and 5597.75 below that.
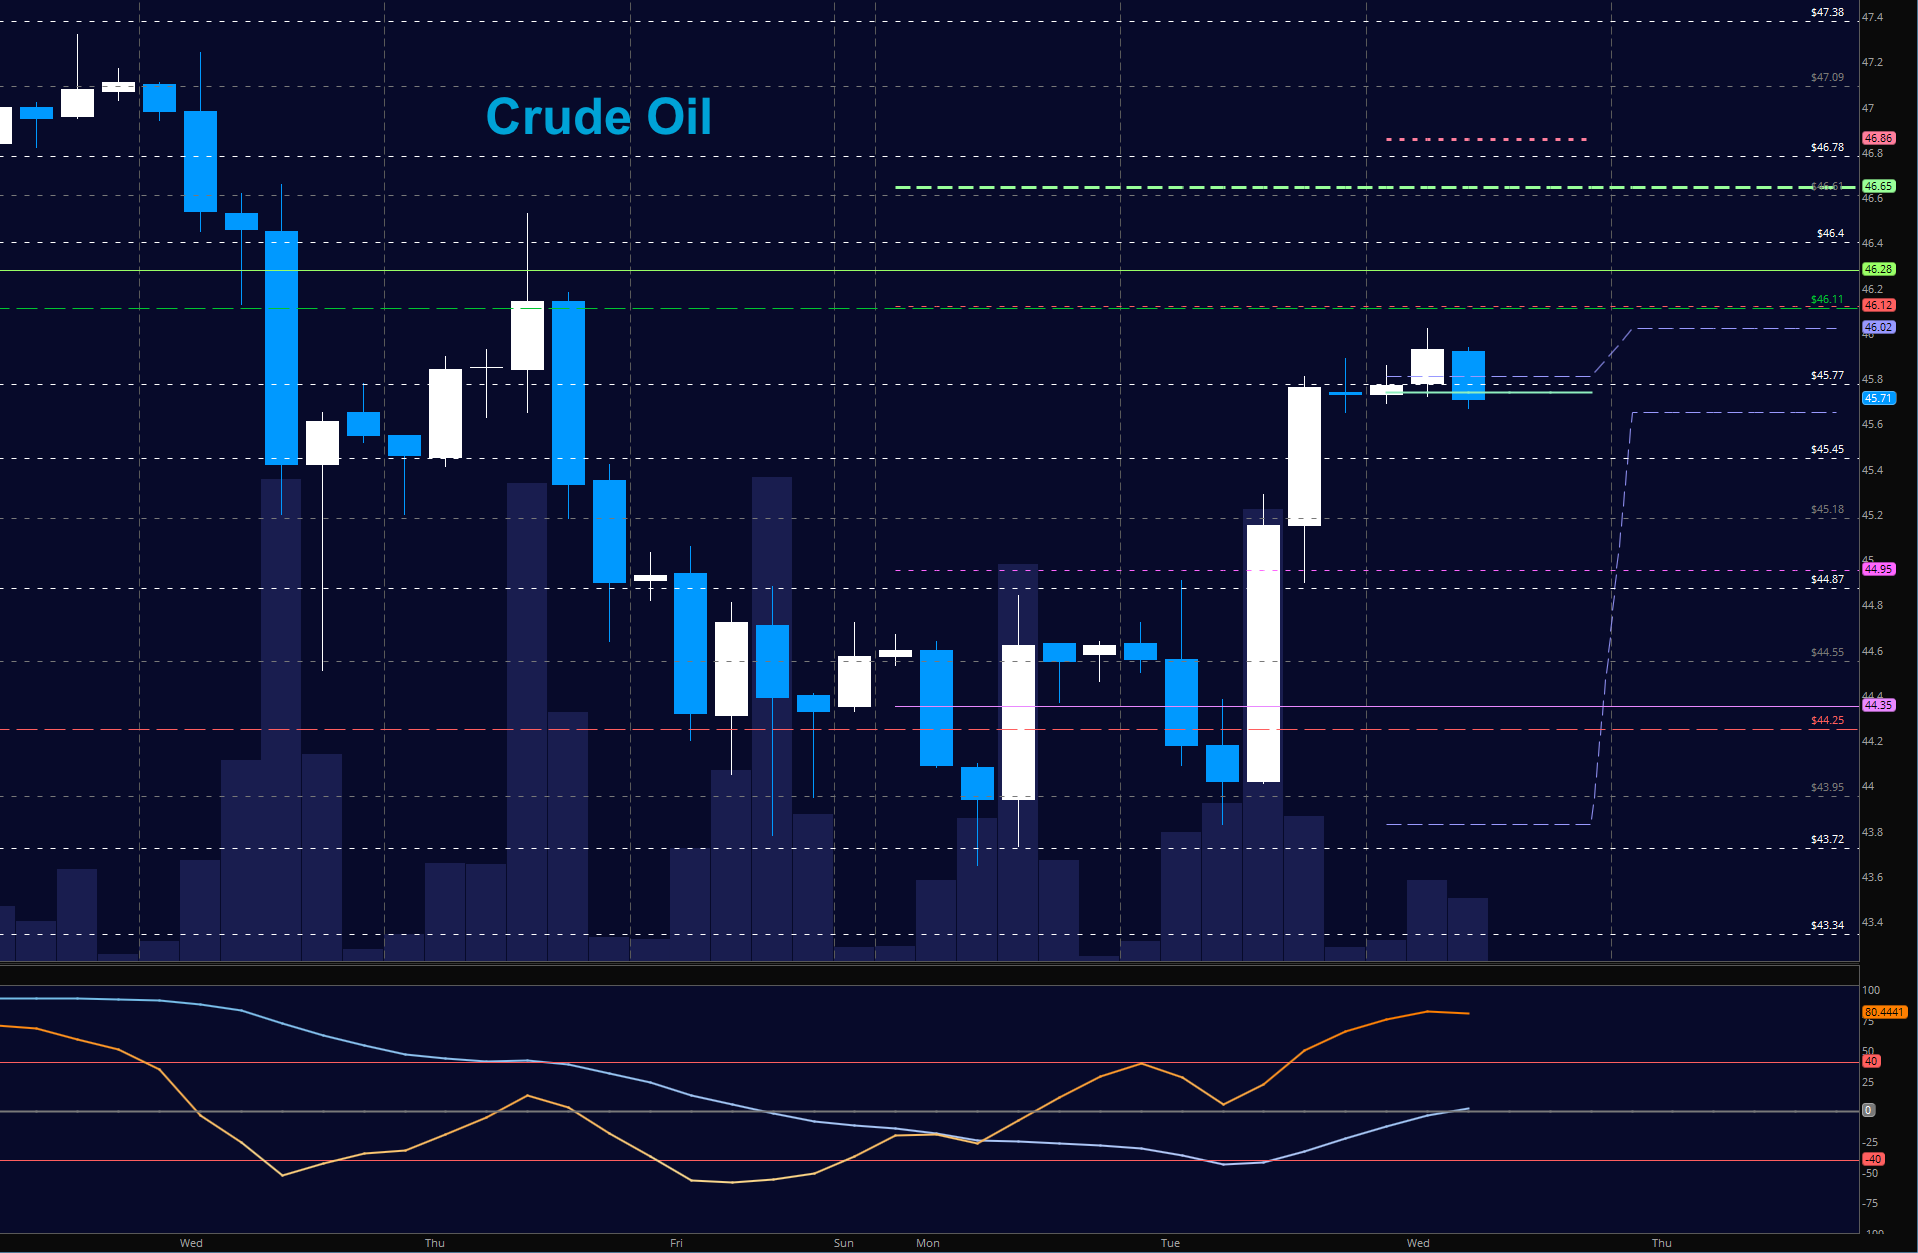
WTI Crude Oil
Oil has spiked into resistance near 46.14. The chart is looking bullish but going long on the breaches seems a bit dangerous. I’ll be looking for a failure to breach new highs to signal a potential reversal on the horizon. The bullets below represent the likely shift of trading momentum at the positive or failed tests at the levels noted.
- Buying pressure intraday will likely strengthen with a positive retest of 46.14 (careful -resistance ahead)
- Selling pressure intraday will strengthen with a failed retest of 45.65
- Resistance sits near 46.14 to 46.4, with 46.64 and 47.09 above that.
- Support holds between 45.45 to 45.18, with 44.87 and 43.75 below that.
If you’re interested in the live trading room, it is now primarily stock market futures content, though we do track heavily traded stocks and their likely daily trajectories as well – we begin at 9am with a morning report and likely chart movements along with trade setups for the day.
As long as the trader keeps himself aware of support and resistance levels, risk can be very adequately managed to play in either direction as bottom picking remains a behavior pattern that is developing with value buyers and speculative traders.
Twitter: @AnneMarieTrades
The author trades stock market futures every day and may have a position in mentioned securities at the time of publication. Any opinions expressed herein are solely those of the author, and do not in any way represent the views or opinions of any other person or entity.


 Ready To Break Out?")