Stock Market Considerations For August 25, 2017
The S&P 500 (INDEXSP:.INX) is pushing higher this morning. Traders will need to be aware of overhead resistance as a means of gauging the morning’s strength. Key futures trading levels for the S&P 500, Nasdaq, and crude oil are listed below.
Check out today’s economic calendar with a full rundown of releases. And note that the charts below are from our premium service and shared exclusively with See It Market readers.
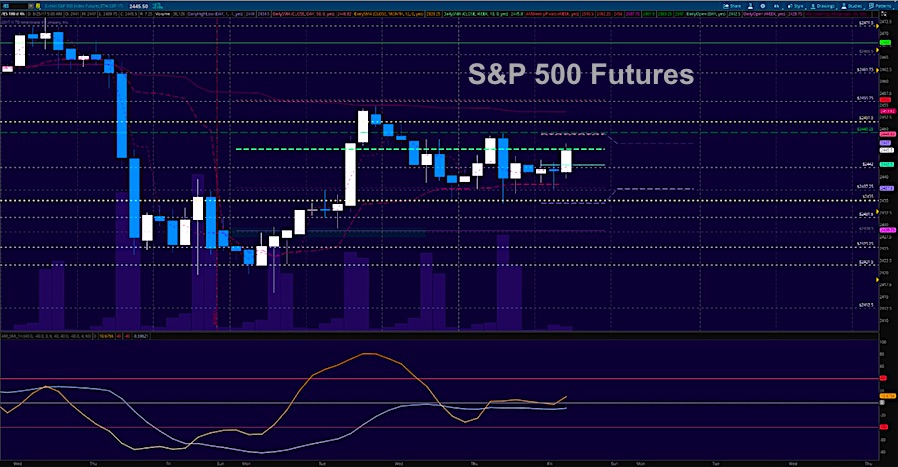
S&P 500 Futures (ES)
The range continues to tighten for the ES_F though lower supports were broken before they recovered. Range based trading techniques are likely required for another day. Momentum intraday is still slightly bullish so pullbacks should hold – traders may be a little too bearish for the environment so watch for the potential squeeze. Planning is required for all good trading – but particularly within spaces where probabilities are not skewed. The bullets below represent the likely shift of trading momentum at the positive or failed retests at the levels noted. The bullets below represent the likely shift of intraday trading momentum at the positive or failed tests at the levels noted.
- Buying pressure intradaywill likely strengthen above a positive retest of 2449.5
- Sellingpressure intraday will likely strengthen with a failed retest of 2435
- Resistance sits near 2446.75 to 2451.25, with 2456 and 2461.25 above that.
- Support holds between 2437.5 and 2434.5, with 2431.5 and 2428.75 below that.
NASDAQ Futures (NQ)
Deep support held yesterday into the bounce and test of resistance that is now being breached this morning. It could be that many traders are now caught short thinking the charts would continue downward. Overall, though, we are still trapped between ranges – 5805 and 5896. Yesterday, the trend really was quite bearish, but we held deep support as expected. Use caution trading the edges here as we could swiftly move in either direction. Momentum intraday is slightly bullish. The bullets below represent the likely shift of intraday trading momentum at the positive or failed tests at the levels noted.
- Buyingpressure intraday will likely strengthen with a positive retest of 5874.75
- Sellingpressure intraday will likely strengthen with a failed retest of 5827.5
- Resistance sits near 5874.75 to 5884.5, with 5896.75 and 5911.5 above that,
- Support holds between 5840.5 and 5829.5, with 5818.75 and 5803.5 below that.
CHART
WTI Crude Oil
Oil remains caught in congestion as buyers and sellers battle for dominance. We breached 47.64 – a key support zone and faded deeply into 47.06, then recovered and recaptured the region this morning. Familiar resistance sits at 47.92. Momentum is mixed but slightly bullish and suggests squeezing price action. The bullets below represent the likely shift of trading momentum at the positive or failed tests at the levels noted.
- Buyingpressure intraday will likely strengthen with a positive retest of 48.06
- Sellingpressure intraday will strengthen with a failed retest of 47.44
- Resistance sits near 48.4 to 48.54, with 48.89 and 49.24 above that.
- Support holds between 47.54 to 47.47, with 47.27 and 47.06 below that.
CHART
If you’re interested in watching these trades go live, join us in the live trading room from 9am to 11:30am each trading day. Visit TheTradingBook for more information.
If you’re interested in the live trading room, it is now primarily stock market futures content, though we do track heavily traded stocks and their likely daily trajectories as well – we begin at 9am with a morning report and likely chart movements along with trade setups for the day.
As long as the trader keeps himself aware of support and resistance levels, risk can be very adequately managed to play in either direction as bottom picking remains a behavior pattern that is developing with value buyers and speculative traders.
Twitter: @AnneMarieTrades
The author trades stock market futures every day and may have a position in mentioned securities at the time of publication. Any opinions expressed herein are solely those of the author, and do not in any way represent the views or opinions of any other person or entity.

: Creating Bullish Divergence?")


: Creating Bullish Divergence?")

