Stock Market Futures Outlook – December 27, 2016
With four trading days left in the year, traders will look to end the year quietly… and green for the S&P 500 (INDEXSP:.INX). A likely test of S&P 500 futures price resistance lies ahead. On Friday price resistance was 2261, and we are again testing that this morning. Market pullbacks to support are still likely to be bought as support is shoeing higher lows in general. Use caution buying breakouts as price action does not show this as capable of holding without collapse.
The lines in the sand for S&P 500 futures buyers to hold will be 2252-2255. Below that, we see 2250.50 and 2247.50. Charts will be weighted to the buyers as long if we recapture and hold 2261. Price resistance holds steady at 2263-2265, but could breach to test 2269.50 to 2272.50.
See today’s economic calendar with a rundown of releases.
TODAY’S RANGE OF MOTION
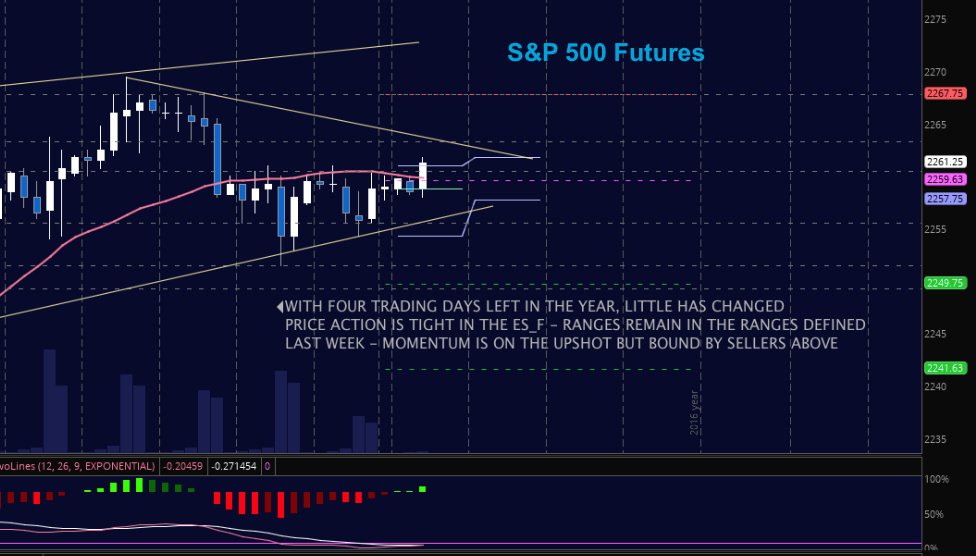
E-mini S&P 500 Futures Trading Chart For December 27
Upside trades – Two options for entry–
Positive retest of continuation level -2261.5 (careful here – a retest is required)
Positive retest of support level– 2255.75
Opening targets ranges for non-members -2257.75, 2261.25, 2263.5, 2267.5, 2269.25, 2271.25, 2272.75, 2275.50, 2278.25 and 2282.50
Downside trades – Two options for entry–
Failed retest of resistance level -2259 (needs retest confirmation- short action a bit countertrend intraday)
Failed retest of support level– 2257 (watch for the higher low that may present)
Opening target ranges for non-members –2254.5, 2251.5, 2249.50, 2246.50, 2242.75, 2238.75, 2234.75, 2231.50, 2227.75, 2224.25, and 2224.25
Nasdaq Futures
The NQ_F is testing trend line resistance this morning. Momentum remains mixed but is positive in general. The wider range bound parameters of trading leaves 4916 as support and 4954 as resistance. Secondary support is 4894 (remember the auction vacuum there). Resistance above 4954 holds near 4957 to 4962.
Upside trades – Two options
Positive retest of continuation level -4945.75 (needs confirmation)
Positive retest of support level– 4934.25 (also needs confirmation)
Opening target ranges for non-members –4937.25, 4941.75, 4944.25, 4948, 4952.75, 4957.75, 4962.25, 4965.50, 4972.25, 4979.75, and 4988.75 (unlikely that we get up here)
Downside trades- Two options
Failed retest of resistance level -4936 (careful here – negative divergence needs to be present)
Failed retest of support level– 4927 (watch for support bounces as the lows continue to be higher)
Opening target ranges for non-members –4931.50, 4927.75, 4923.75, 4917.75, 4914.25, 4907.50, 4902.75, 4898.75, 4883.75, 4876.25, 4872.25, 4863.75, 4859.75, 4854.75, and 4847.50
WTI Crude Oil
The oil contract expiring in February is forming a wedge with levels of interest near The region near 53.63 and 53.8 as resistance and holding 53.06 to 52.7 as support. We are holding steady and momentum continues to be mixed.
Upside trades – Two options
Positive retest of continuation level -53.3 (needs a retest)
Positive retest of support level– 52.8
Opening target ranges for non-members –52.3, 52.54, 52.97, 53.23, 53.41, 53.6, 53.86, 54.04, 54.21, 54.5, 54.97, and 55.4
Downside trades – Two options
Failed retest of resistance level -53.03
Failed retest of support level– 52.70 (needs a failed retest)
Opening target ranges for non-members –52.76, 52.32, 52.09, 51.85, 51.57, 51.32, 51.08, 50.27, 50.13, 49.87, 49.6, 49.27, 49.05, and 48.92
If you’re interested in watching these trades go live, join us in the live trading room from 9am to 11:30am each trading day.
Visit TheTradingBook for more information.
If you’re interested in the live trading room, it is now primarily stock market futures content, though we do track heavily traded stocks and their likely daily trajectories as well – we begin at 9am with a morning report and likely chart movements along with trade setups for the day.
As long as the trader keeps himself aware of support and resistance levels, risk can be very adequately managed to play in either direction as bottom picking remains a behavior pattern that is developing with value buyers and speculative traders.
Twitter: @AnneMarieTrades
The author trades stock market futures every day and may have a position in mentioned securities at the time of publication. Any opinions expressed herein are solely those of the author, and do not in any way represent the views or opinions of any other person or entity.


: Showing Some Signs of Emerging Strength")
