Stock Market Futures Trading Considerations For August 30, 2017
The S&P 500 Index (INDEXSP:.INX) is looking to build on yesterday’s reversal to the upside. Traders will once again eye key resistance to see if we score a breakout or breakdown. Trading levels listed below.
Check out today’s economic calendar with a full rundown of releases. And note that the charts below are from our premium service and shared exclusively with See It Market readers.
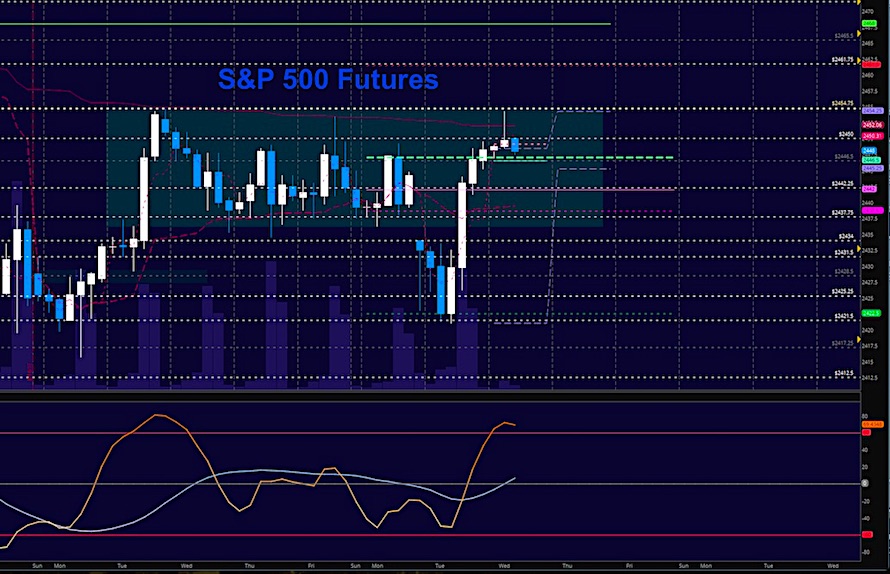
S&P 500 Futures (ES)
A BIG BOUNCE TOOK HOLD YESTERDAY AS ALGORITHMS took us right into prior resistance. As long as the chart holds 2434, we should have bulls coming to the rescue but we sit at reversal at this time into higher lows. Formations from last week Tuesday look very familiar. The bullets below represent the likely shift of trading momentum at the positive or failed retests at the levels noted. The bullets below represent the likely shift of intraday trading momentum at the positive or failed tests at the levels noted.
- Buying pressure intradaywill likely strengthen above a positive retest of 2451
- Sellingpressure intraday will likely strengthen with a failed retest of 2440
- Resistance sits near 2450 to 2454.75, with 2461.75 and 2468.5 above that.
- Support holds between 2442 and 2438.5, with 2434.5 and 2429.5 below that.
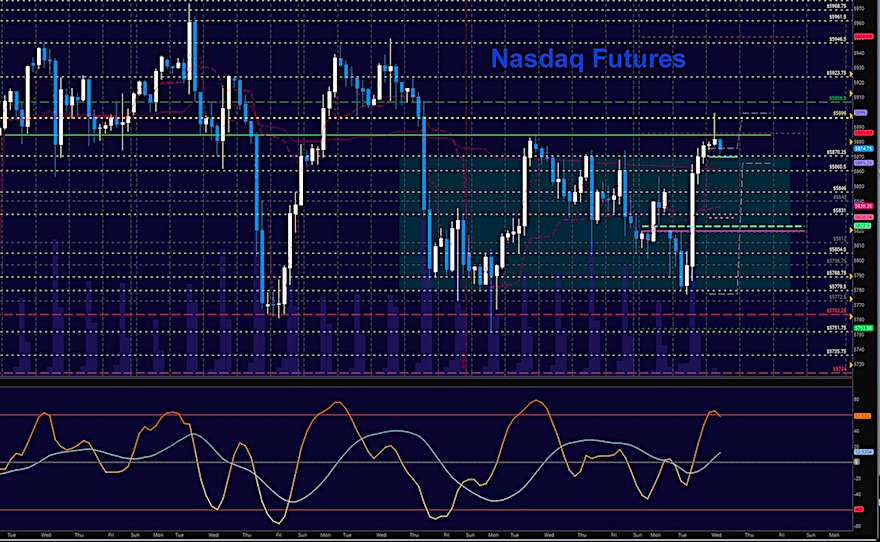
NASDAQ Futures (NQ)
The bounce yesterday was swift and sent us into resistance. Firs pullbacks will be buying zones but watch for the lower high to appear as this will show us that we have reversal potentially in the mix to deeper support. Momentum intraday is slightly bullish but may reverse quickly. The bullets below represent the likely shift of intraday trading momentum at the positive or failed tests at the levels noted.
- Buyingpressure intraday will likely strengthen with a positive retest of 5886.75
- Sellingpressure intraday will likely strengthen with a failed retest of 5858
- Resistance sits near 5880.75 to 5886.25, with 5899 and 5912.5 above that.
- Support holds between 5865.25 and 5851.5, with 5828.75 and 5815.5 below that.
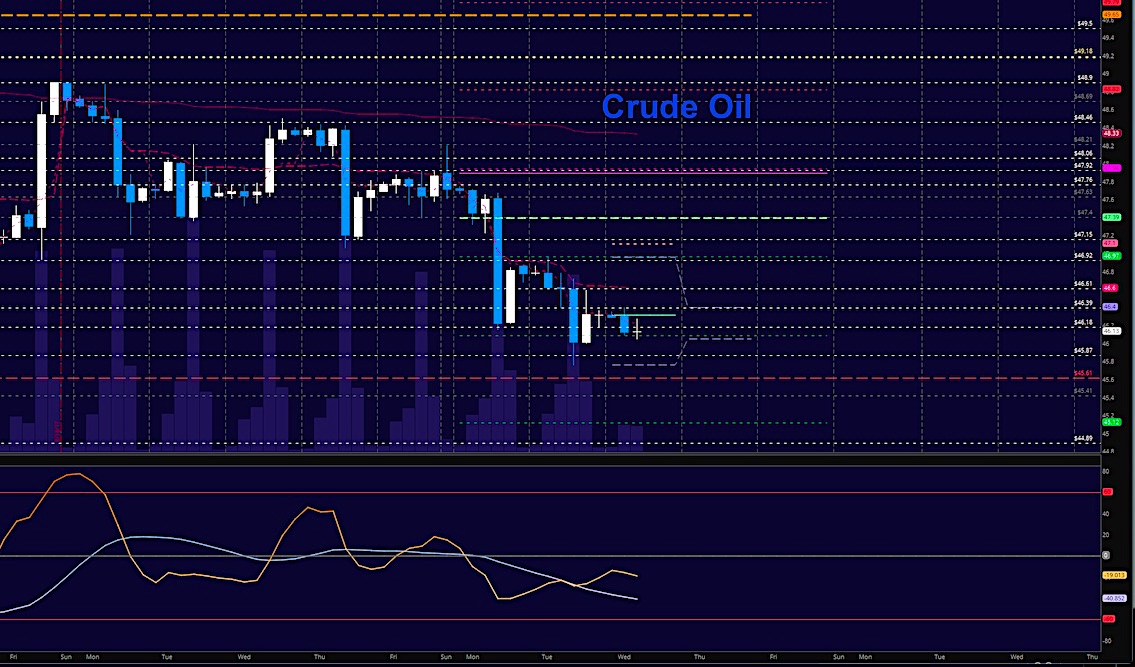
WTI Crude Oil
Into the EIA report, charts are holding lower levels with another lower high presenting yesterday. Deep support continues to be bought and big bounces are very likely to be sold at the first pass. Momentum is slightly bearish. The bullets below represent the likely shift of trading momentum at the positive or failed tests at the levels noted.
- Buyingpressure intraday will likely strengthen with a positive retest of 46.94
- Sellingpressure intraday will strengthen with a failed retest of 45.9
- Resistance sits near 47.04 to 47.44, with 47.74 and 48.06 above that.
- Support holds between 46.04 to 45.87, with 45.61 and 45.12 below that.
If you’re interested in the live trading room, it is now primarily stock market futures content, though we do track heavily traded stocks and their likely daily trajectories as well – we begin at 9am with a morning report and likely chart movements along with trade setups for the day.
As long as the trader keeps himself aware of support and resistance levels, risk can be very adequately managed to play in either direction as bottom picking remains a behavior pattern that is developing with value buyers and speculative traders.
Twitter: @AnneMarieTrades
The author trades stock market futures every day and may have a position in mentioned securities at the time of publication. Any opinions expressed herein are solely those of the author, and do not in any way represent the views or opinions of any other person or entity.
: Creating Bullish Divergence?")


: Creating Bullish Divergence?")