The S&P 500 (NYSEARCA: SPY) and Nasdaq (NASDAQ: QQQ) are looking to settle down after a few days of jarring news from the emerging markets hit select currencies.
Price resistance on the S&P 500 failed overnight as the index battles familiar support/resistance zones.
The charts feel landlocked but likely to give back gains from resistance. Watch the support and resistance levels highlighted below as both sets of levels are in play, depending on which way the market breaks.
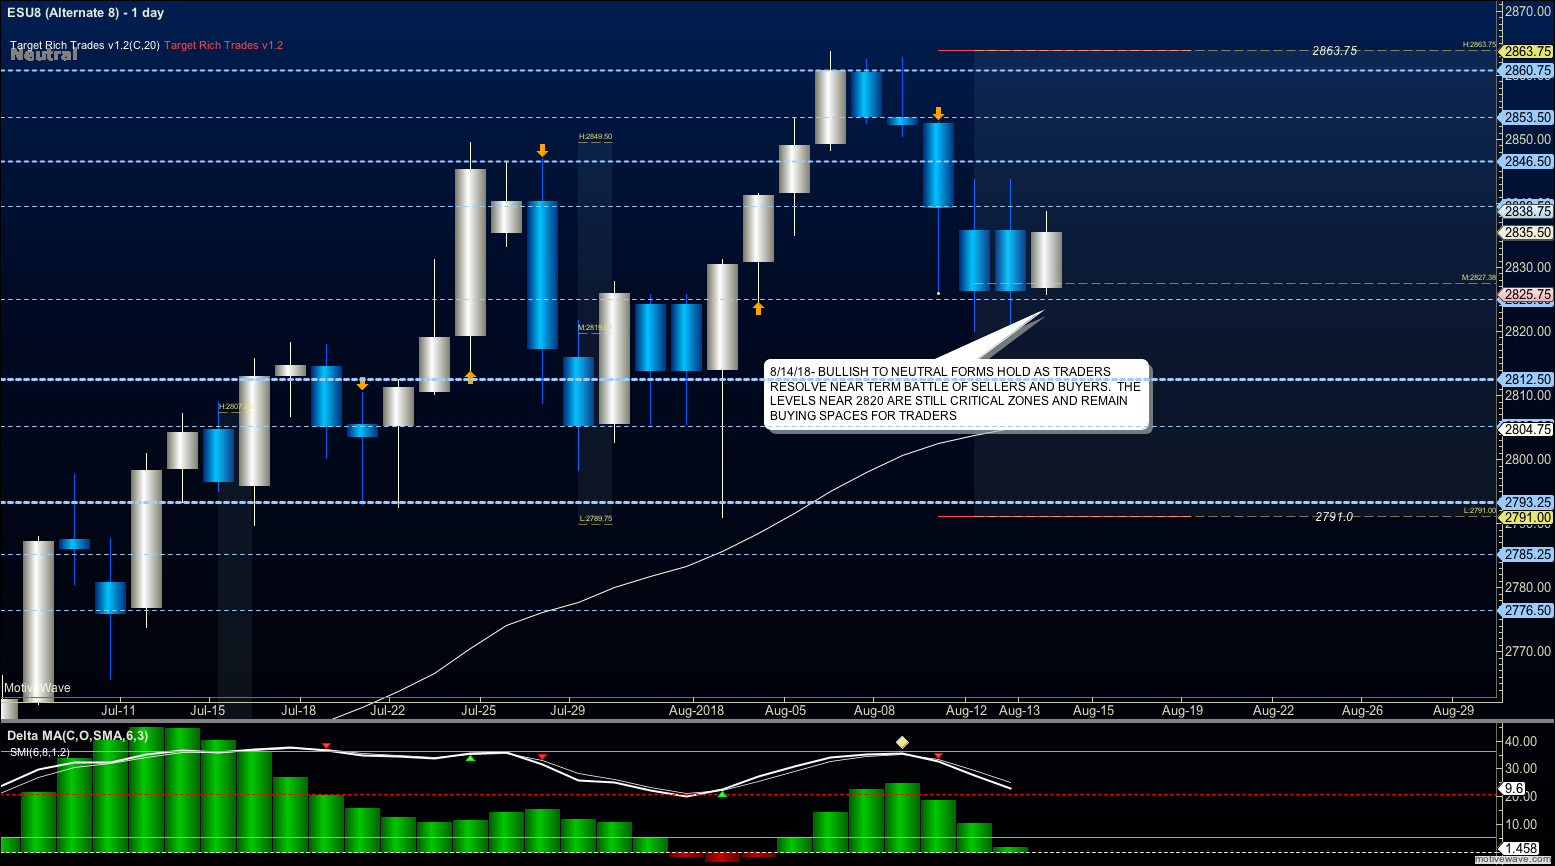
S&P 500 Futures
Support holds near 2820 but traders not breaching 2840.
Repeated testing of resistance as momentum drifts south (the current backdrop) potentially suggests sideways or bearish action until this resistance breaks to the upside. This does not mean bullish motion is gone, only stalled in the early hours. Sellers have more power below 2846. The bullets below represent the likely shift of intraday trading momentum at the successful or failed retests at the levels noted.
- Buying pressure intraday will likely strengthen with a bullish retest of 2841.75
- Selling pressure intraday will likely strengthen with a bearish retest of 2824.75
- Resistance sits near 2839.75 to 2844.25, with 2852.75 and 2857.75 above that
- Support sits between 2824.25 and 2819.75, with 2813.5 and 2789.75
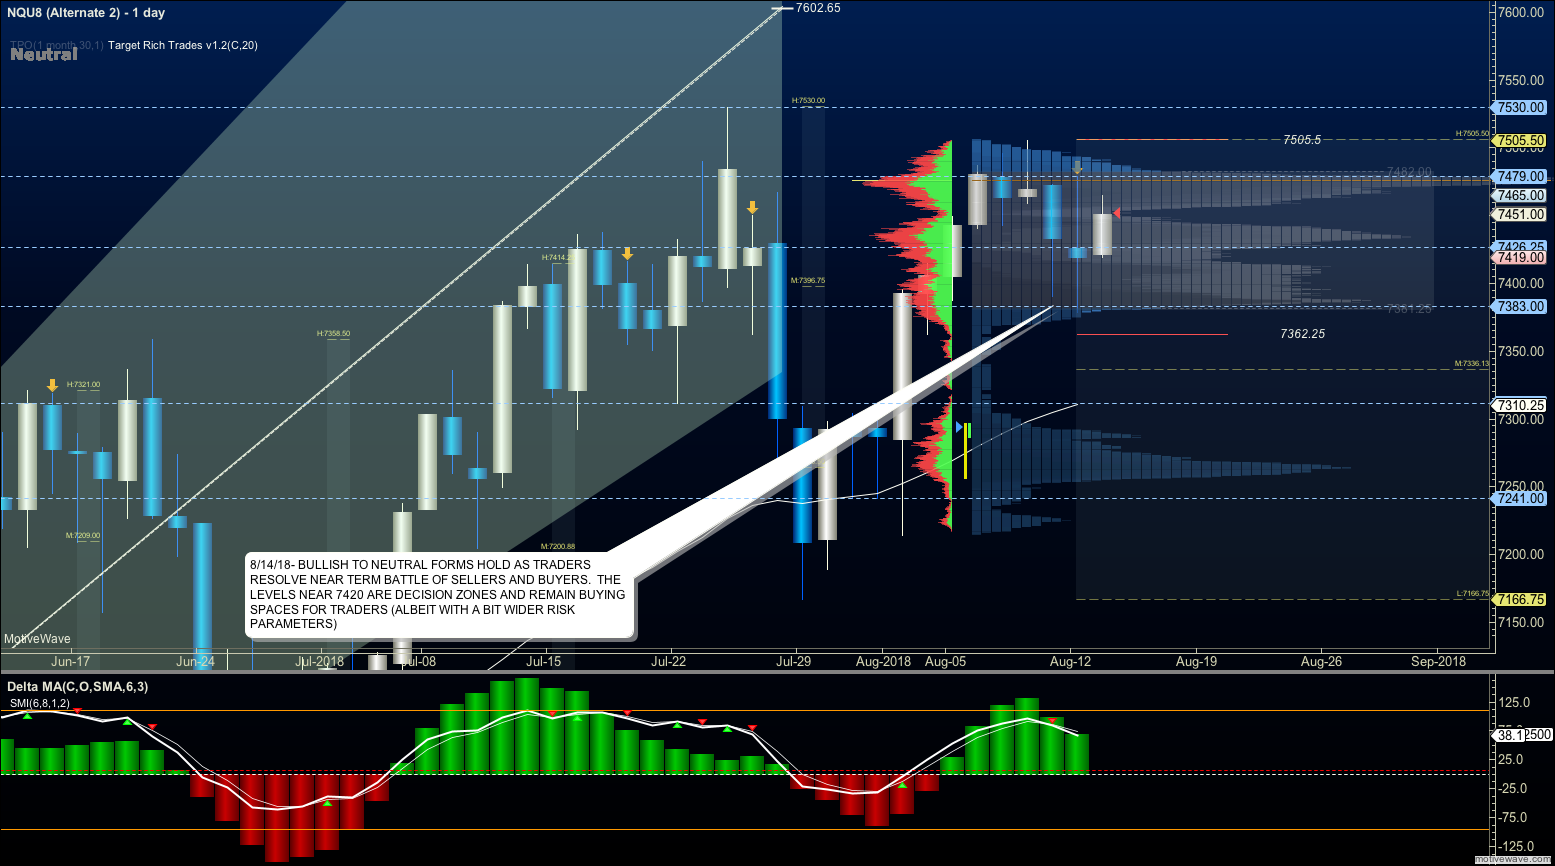
NASDAQ Futures
Buyers hold higher support but breaching resistance remains difficult.
It is very choppy between the 7400-7460 regions, so use caution and pay attention to the congestion. The bullets below represent the likely shift of intraday trading momentum at the successful or failed retests at the levels noted.
- Buying pressure intraday will likely strengthen with a bullish retest of 7462.75
- Selling pressure intraday will likely strengthen with a bearish retest of 7432.5
- Resistance sits near 7451.5 to 7465.5 with 7478.5 and 7508.25 above that.
- Support sits between 7436.5 and 7424.75, with 7406.5 and 7362.75 below that.
WTI Crude Oil
Traders bounced sharply after a deep fade into lows not seen in the current contract.
Traders will attempt to recapture 68.21 which stands as the next line of resistance for now but the speed at which we moved suggests that a test of higher support is likely on track for today. The bullets below represent the likely shift of intraday trading momentum at the successful or failed retests at the levels noted.
- Buying pressure intraday will likely strengthen with a bullish retest of 68.34
- Selling pressure intraday will strengthen with a bearish retest of 67.7
- Resistance sits near 68.12 to 68.4, with 68.8 and 69.32 above that.
- Support holds near 67.95 to 67.72, with 67.37 and 66.28 below that.
You can learn more about trading and our memberships HERE.
Twitter: @AnneMarieTrades
The author trades stock market futures every day and may have a position in mentioned securities at the time of publication. Any opinions expressed herein are solely those of the author, and do not in any way represent the views or opinions of any other person or entity.


