Stock Market Futures Trading Overview For April 6, 2017
Things unraveled quickly across the stock market yesterday. Moving into today, traders will be watching key support levels on the S&P 500 (INDEXSP:.INX), Nasdaq (INDEXNASDAQ:.IXIC), and crude oil. Below is a recap of each futures contract and trading charts.
Check out today’s economic calendar with a full rundown of releases. And note that the charts below are from our premium service at The Trading Book and are shared exclusively with See It Market readers.
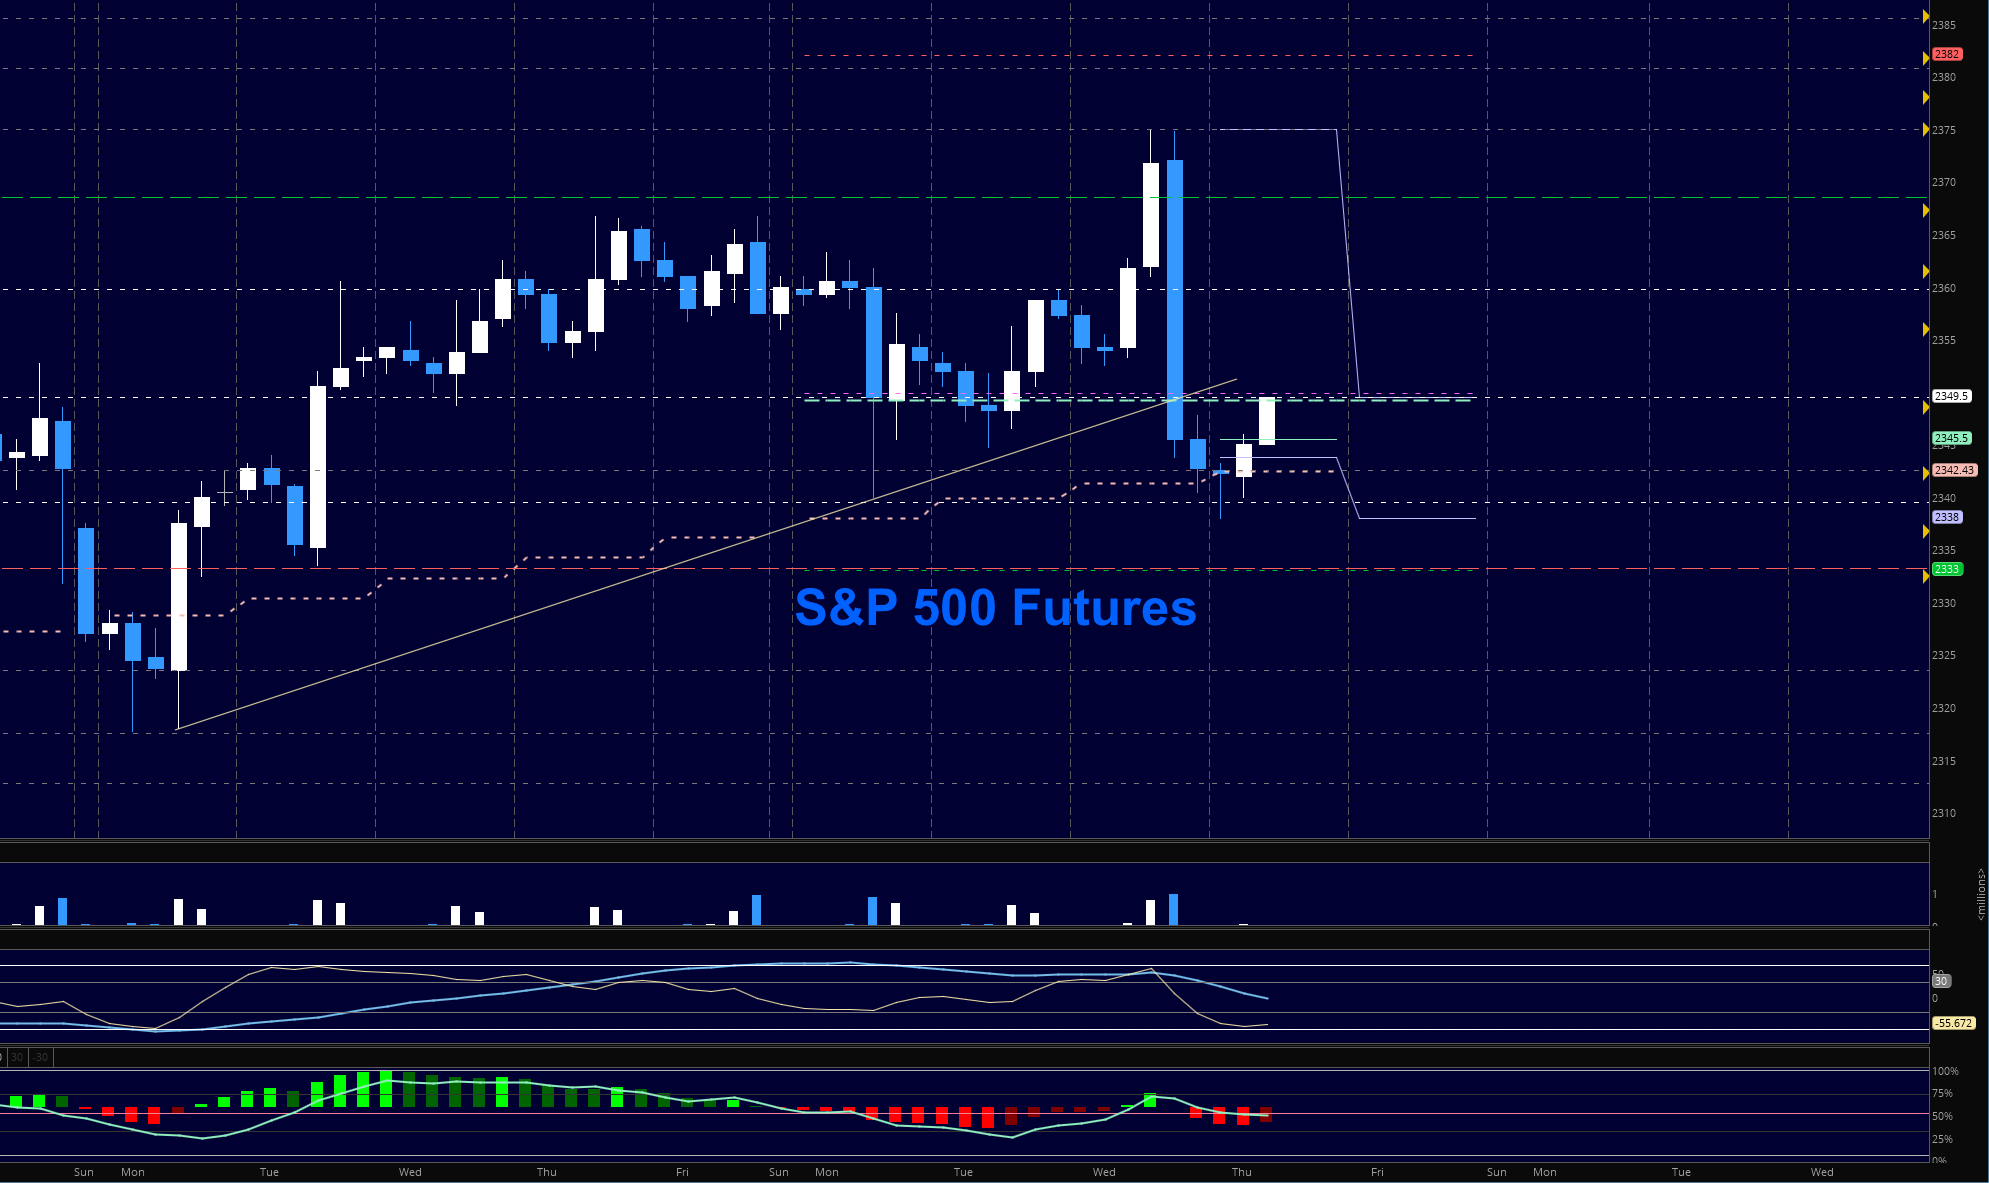
S&P 500 Futures (ES)
After a spike above into the edge of the resistance levels noted, charts had a later afternoon fade that sold into the close. Evening trading looked even worse as we tested 2338 and then bounced. We are in reverse but I am cautiously optimistic about price action. End sum at this time is that we are still range bound as we test and hold 2347. My suspicion is still that both rise and fade are likely to reject as range bound behavior still continues. This is an excellent opportunity for intraday traders but very discouraging to swing traders who position themselves intraday. The deep dip gave value buyers a great chance to get involved in the cycle.
- Buying pressure will likely strengthen above a positive retest of 2349.75 (but more resistance is ahead nearby)
- Selling pressure will likely strengthen with a failed retest of 2339
- Resistance sits near 2359.5 to 2363.5, with 2369.5 and 2376.25 above that
- Support holds between 2339 and 2330.5, with 2323.5 and 2317.5 below that
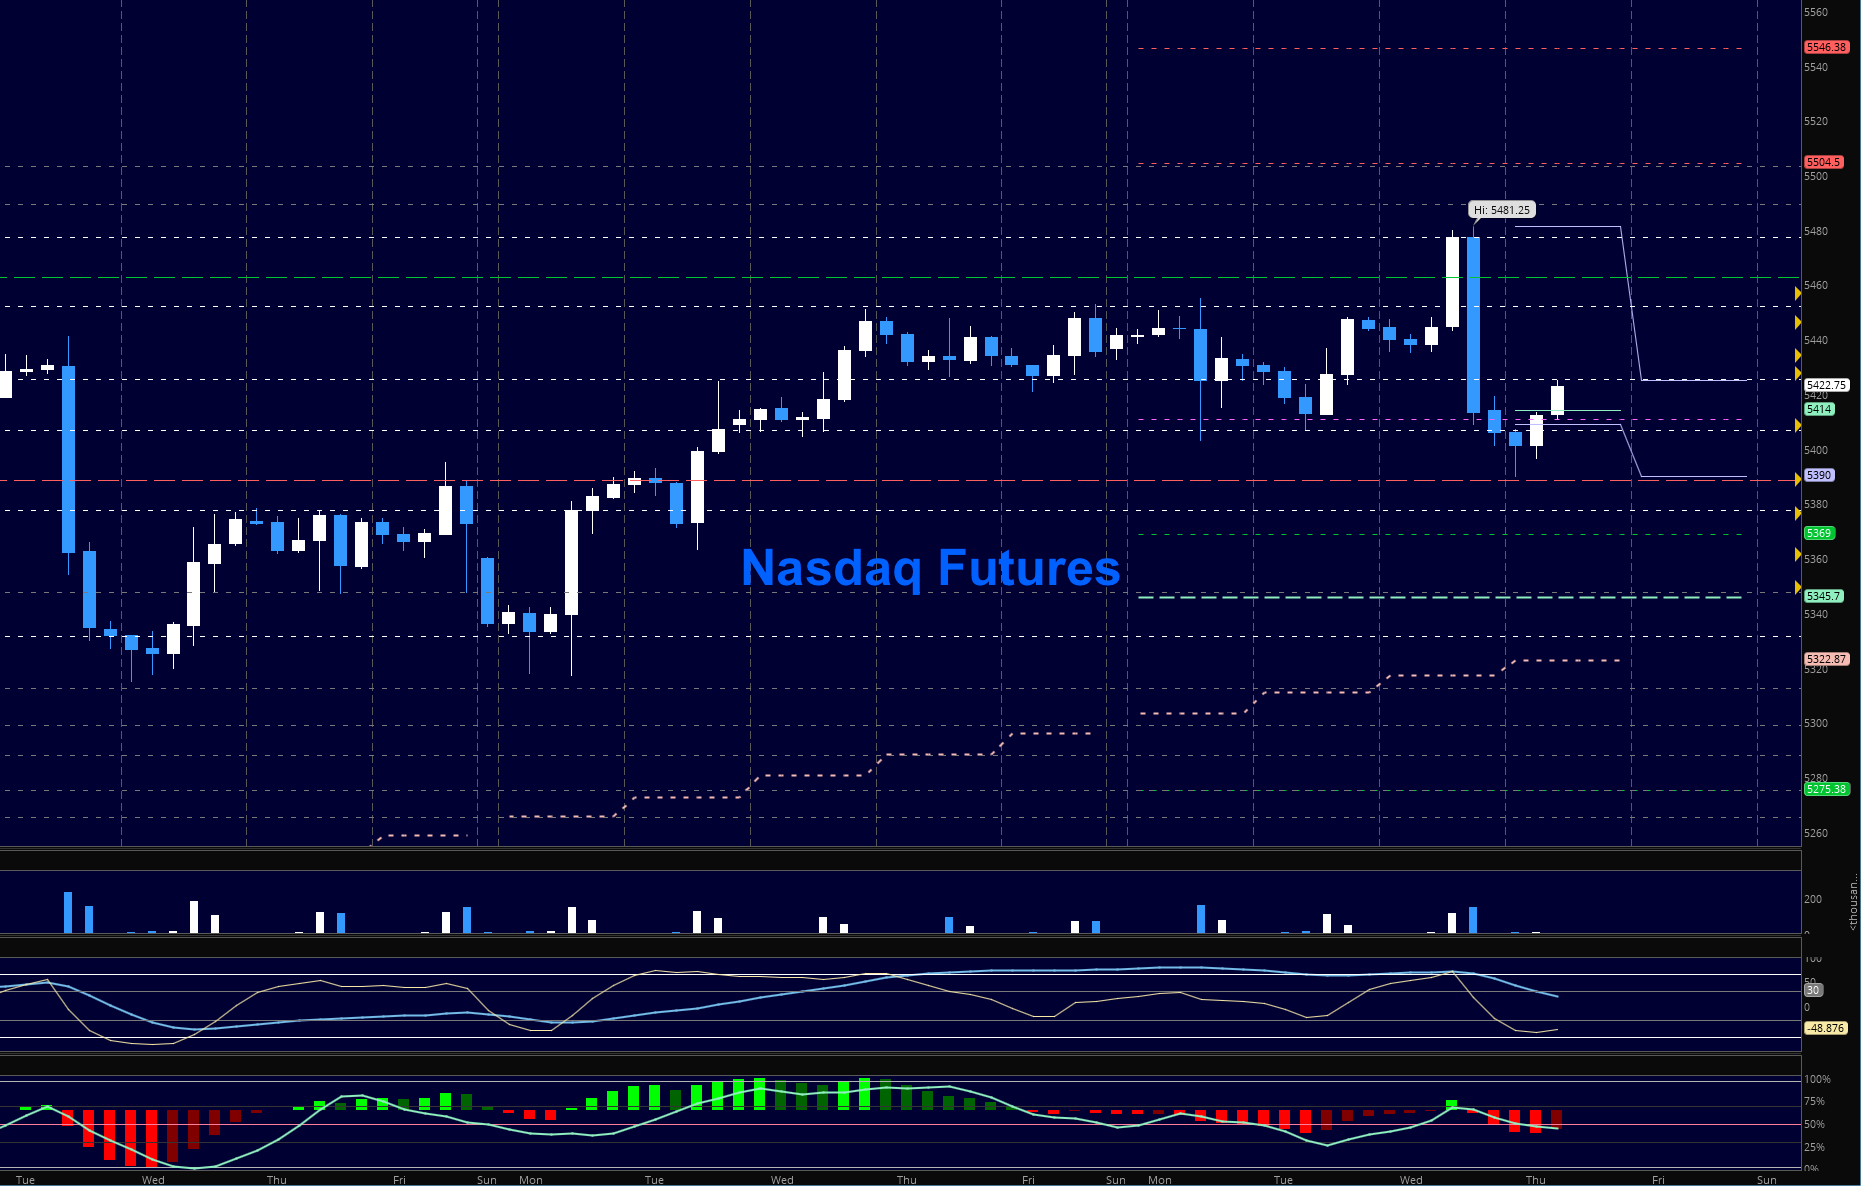
Nasdaq Futures (NQ)
Momentum held steady yesterday as the NQ_F also held the lows of the prior day. Squeezing patterns tell us we are sure to have a break in the near term. It appears we are likely to break up versus breakdown but as I mentioned in past posts, these breaks are not likely to hold. New support levels to watch are in the 5410 region. Fades will be bought in this environment. The chart is not in a breakdown formation. As yesterday, use caution going long at the upper edge of the ranges.
- Buying pressure will likely strengthen with a positive retest of 5452 (use caution as sellers sit up here-wait for a retest)
- Selling pressure will likely strengthen with a failed retest of 5406
- Resistance sits near 5456 to 5462.75, with 5477.25 and 5489.5 above that
- Support holds between 5404.75 and 5388.5, with 5377.5 and 5347.5 below that
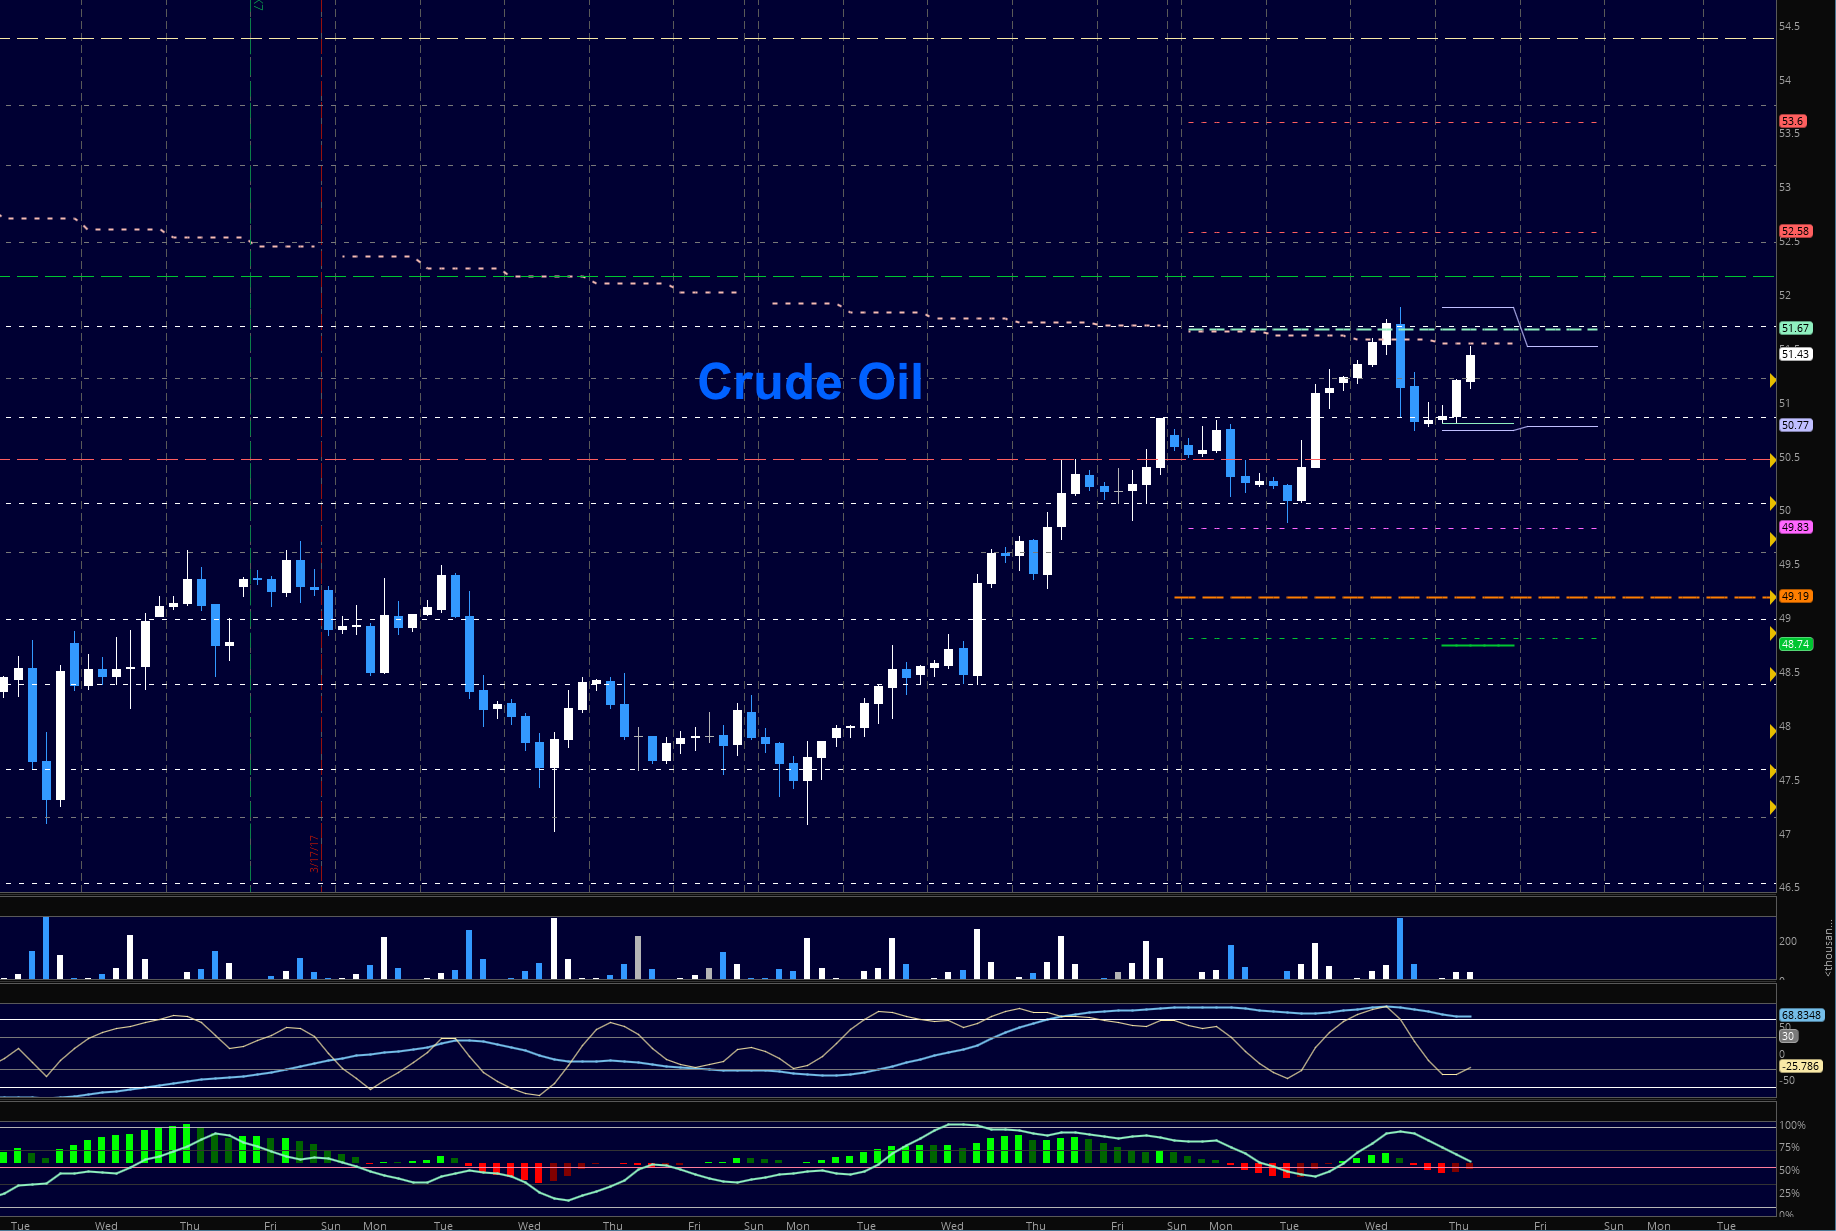
Crude Oil –WTI
Our magnet price of 51.7 shows as important again this morning as bounces off support are holding well for now. This second test of 51.7 will be under less momentum so it should reject at the first pass. Builds in inventories and draws in distillates. The test of 52.5 is next if we can keep the level at 51.78. Support holds below at 50.06.
- Buying pressure will likely strengthen with a positive retest of 51.85
- Selling pressure will strengthen with a failed retest of 51.2
- Resistance sits near 51.85 to 52.17, with 52.48 and 52.7 above that.
- Support holds between 51.2 and 50.77, with 50.47 and 50.06 below that.
If you’re interested in watching these trades go live, join us in the live trading room from 9am to 11:30am each trading day. Visit TheTradingBook for more information.
Our live trading room is now primarily stock market futures content, though we do track heavily traded stocks and their likely daily trajectories as well – we begin at 9am with a morning report and likely chart movements along with trade setups for the day.
As long as the trader keeps himself aware of support and resistance levels, risk can be very adequately managed to play in either direction as bottom picking remains a behavior pattern that is developing with value buyers and speculative traders.
Twitter: @AnneMarieTrades
The author trades stock market futures every day and may have a position in mentioned securities at the time of publication. Any opinions expressed herein are solely those of the author, and do not in any way represent the views or opinions of any other person or entity.

")


