Broad Stock Market Futures Outlook for April 30, 2018
The first trading days of April were quite volatile with long candles and long wicks. The last trading days of April have seen much more compressed in price action.
But today we are at a key price level on the S&P 500, that if breached will signal significant range expansion into higher resistance. The undercurrents are weak, so the likelihood of this remains small. Buying pressure is still weaker in general across the board, so the cross-currents of motion continue. Pullbacks should be buying zones, but the failure to advance will sound the alert for exhaustion upward for the intraday cycle.
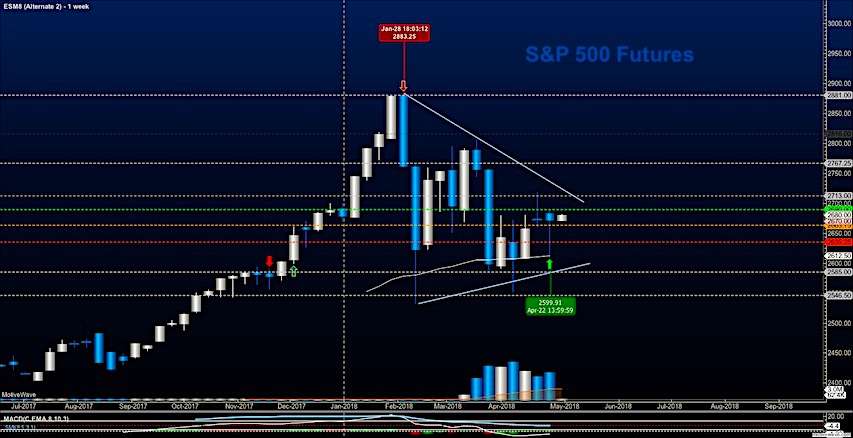
S&P 500 Futures
Resistance still sits near familiar spaces, but we have breached them and are currently holding. This suggests we will move to higher resistance before sellers attempt any kind of fade. Price compression continues, suggesting we have another solid move on the horizon but the market is holding direction close to the vest – which suggests to me we will have plenty of time to enter on the retrace of any breakouts or breakdowns. The bullets below represent the likely shift of trading momentum at the positive or failed retests at the levels noted.
- Buying pressure intraday will likely strengthen with a bullish retest of 2682.75
- Selling pressure intraday will likely strengthen with a bearish retest of 2670.5
- Resistance sits near 2679.5 to 2687.75, with 2699.25 and 2713.75 above that.
- Support sits between 2670.5 and 2664.5, with 2659.5 and 2646.50
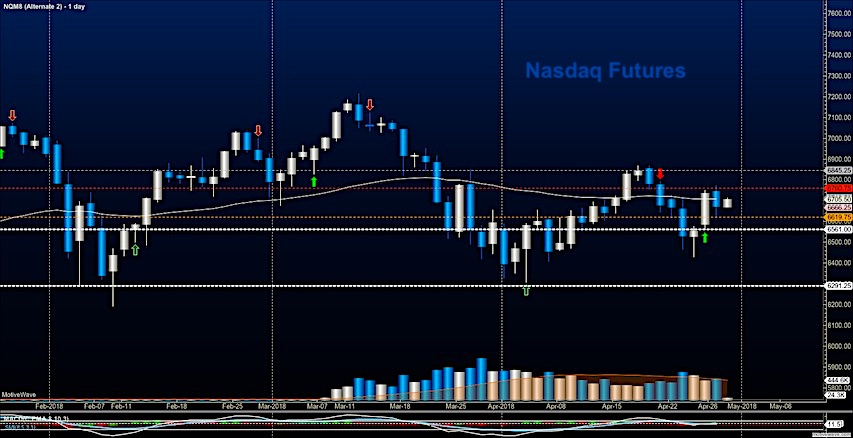
NASDAQ Futures
Cautious trading into resistance continues (that means buying at pullbacks into support rather than at the breakouts) with a line in the sand near 6650. Weak bullish undercurrents are present so the potential for price fades that recover is certainly there. The bullets below represent the likely shift of intraday trading momentum at the positive or failed tests at the levels noted.
- Buying pressure intraday will likely strengthen with a bullish retest of 6721.75
- Selling pressure intraday will likely strengthen with a bearish retest of 6665
- Resistance sits near 6717.5 to 6746.25 with 6778.25 and 6839.75 above that.
- Support sits between 6698.5 and 6654.5, with 6642.5 and 6594.75 below that.
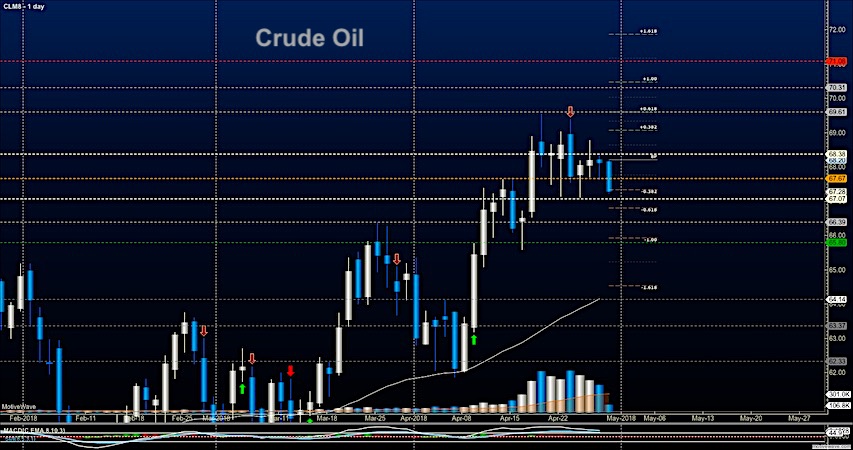
WTI Crude Oil
We can see a recent bounce off 67.2 so this will be a likely tipping point today. As support failed Friday, the bounces presented selling events for traders and this formation continues in the hint for deeper support. Short action at the critical region near 67.7 is favorable with tight stops. The bullets below represent the likely shift of intraday trading momentum at the positive or failed tests at the levels noted.
- Buying pressure intraday will likely strengthen with a bullish retest of 68.34
- Selling pressure intraday will strengthen with a bearish retest of 67.14
- Resistance sits near 67.7 to 68.28, with 68.87 and 70.22 above that.
- Support holds near 67.16 to 66.97, with 66.54 and 65.9 below that.
Twitter: @AnneMarieTrades
The author trades stock market futures every day and may have a position in mentioned securities at the time of publication. Any opinions expressed herein are solely those of the author, and do not in any way represent the views or opinions of any other person or entity.
: Creating Bullish Divergence?")


: Creating Bullish Divergence?")