Broad Stock Market Futures Outlook for April 25, 2018
The failure to head higher combined with the break of solid price support has lead to a deep decline in the S&P 500 and broad indices.
I suspect we shall see analysts begin to revise estimates downward after this quarter of earnings releases, in general. Sellers are in command of the charts but bounces are very likely here. They are also likely to fail at their first pass into resistance. Watch for a rounded bottom intraday, or perhaps even a lower low before we begin to stabilize. Exercise caution with position size if you are trying to play reversals. And stay nimble, pulling out of the trade if price fails to breach areas it should recover.
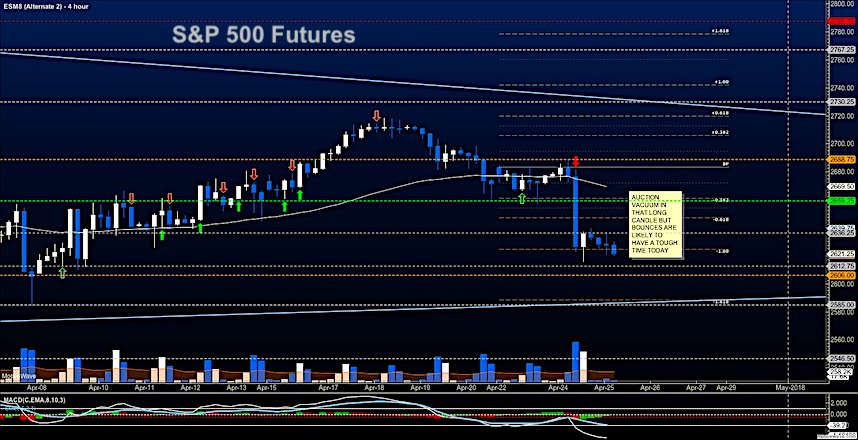
S&P 500 Futures
Deep support tested after the low of Monday was tested. Below 2660, there is quite a bit of selling power in the chart so bounce action is likely to fail at the first attempt out of the basement here =). I am expecting a bit of price compression with respect to months in the recent past. That is why we are seeing the wedge formation noted (see tweet on $ES_F). The bullets below represent the likely shift of trading momentum at the positive or failed retests at the levels noted.
- Buying pressure intraday will likely strengthen with a bullish retest of 2636.75
- Selling pressure intraday will likely strengthen with a bearish retest of 2620.50
- Resistance sits near 2629.25 to 2642.75, with 2654.25 and 2672.75 above that.
- Support sits between 2615.5 and 2604.5, with 2594.5 and 2585.50
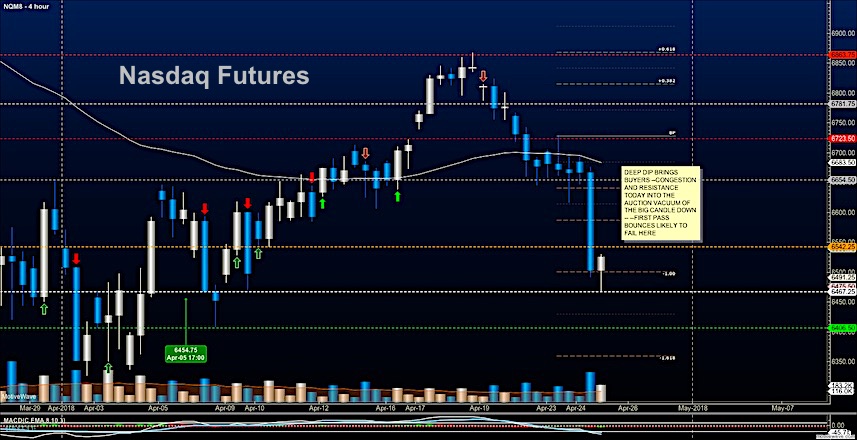
NASDAQ Futures
Once 6655 gave way to sellers, traders piled on for close to 800 ticks yesterday before attempting any kind of bounce event, led lower by GOOGL and others. A weak bounce is in play and the undercurrents suggest that this bounce will fade at resistance near 6557 the first time it heads there. Cautious trading as we near weekly support under negative momentum. The bullets below represent the likely shift of intraday trading momentum at the positive or failed tests at the levels noted.
- Buying pressure intraday will likely strengthen with a bullish retest of 6546.75
- Selling pressure intraday will likely strengthen with a bearish retest of 6484
- Resistance sits near 6538.5 to 6557.25 with 6591.25 and 6646.25 above that.
- Support sits between 6486.5 and 6454.5, with 6434.5 and 6407.75 below that.
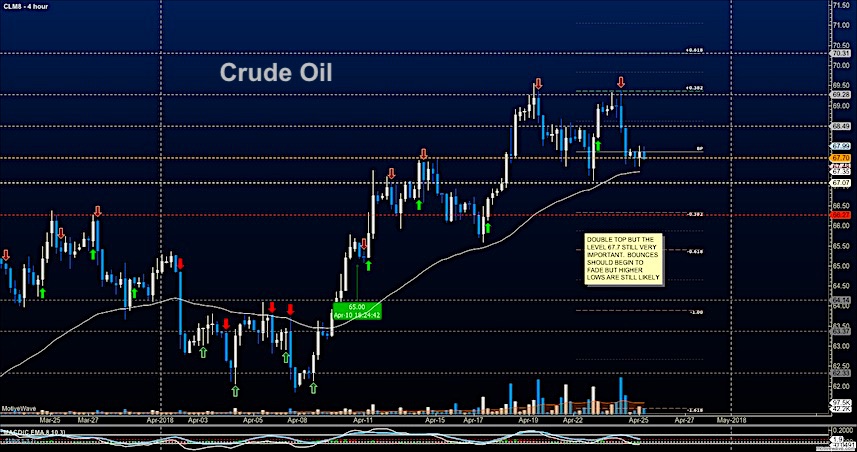
WTI Crude Oil
EIA report today as traders take us below 67.7 this morning. Buyers are present below near 67.48 and remain in a congestion with sellers but this is a critical zone for traders to hold steady if they are keen on price action resuming upward. The bullets below represent the likely shift of intraday trading momentum at the positive or failed tests at the levels noted.
- Buying pressure intraday will likely strengthen with a bullish retest of 68.06
- Selling pressure intraday will strengthen with a bearish retest of 67.43
- Resistance sits near 67.99 to 68.38, with 68.74 and 70.22 above that.
- Support holds near 67.5 to 67.18, with 66.78 and 66.37 below that.
Twitter: @AnneMarieTrades
The author trades stock market futures every day and may have a position in mentioned securities at the time of publication. Any opinions expressed herein are solely those of the author, and do not in any way represent the views or opinions of any other person or entity.


