Stock Market Considerations For December 15, 2017
The S&P 500 (INDEXSP:.INX) and Nasdaq (INDEXNASDAQ:.IXIC) are rallying higher on Friday morning. The strength and fortitude of buyers and this bull market is truly amazing. But we have to follow our price levels and indicators each day or we will be humbled. In the commentary below I break down both futures indices along with crude oil.
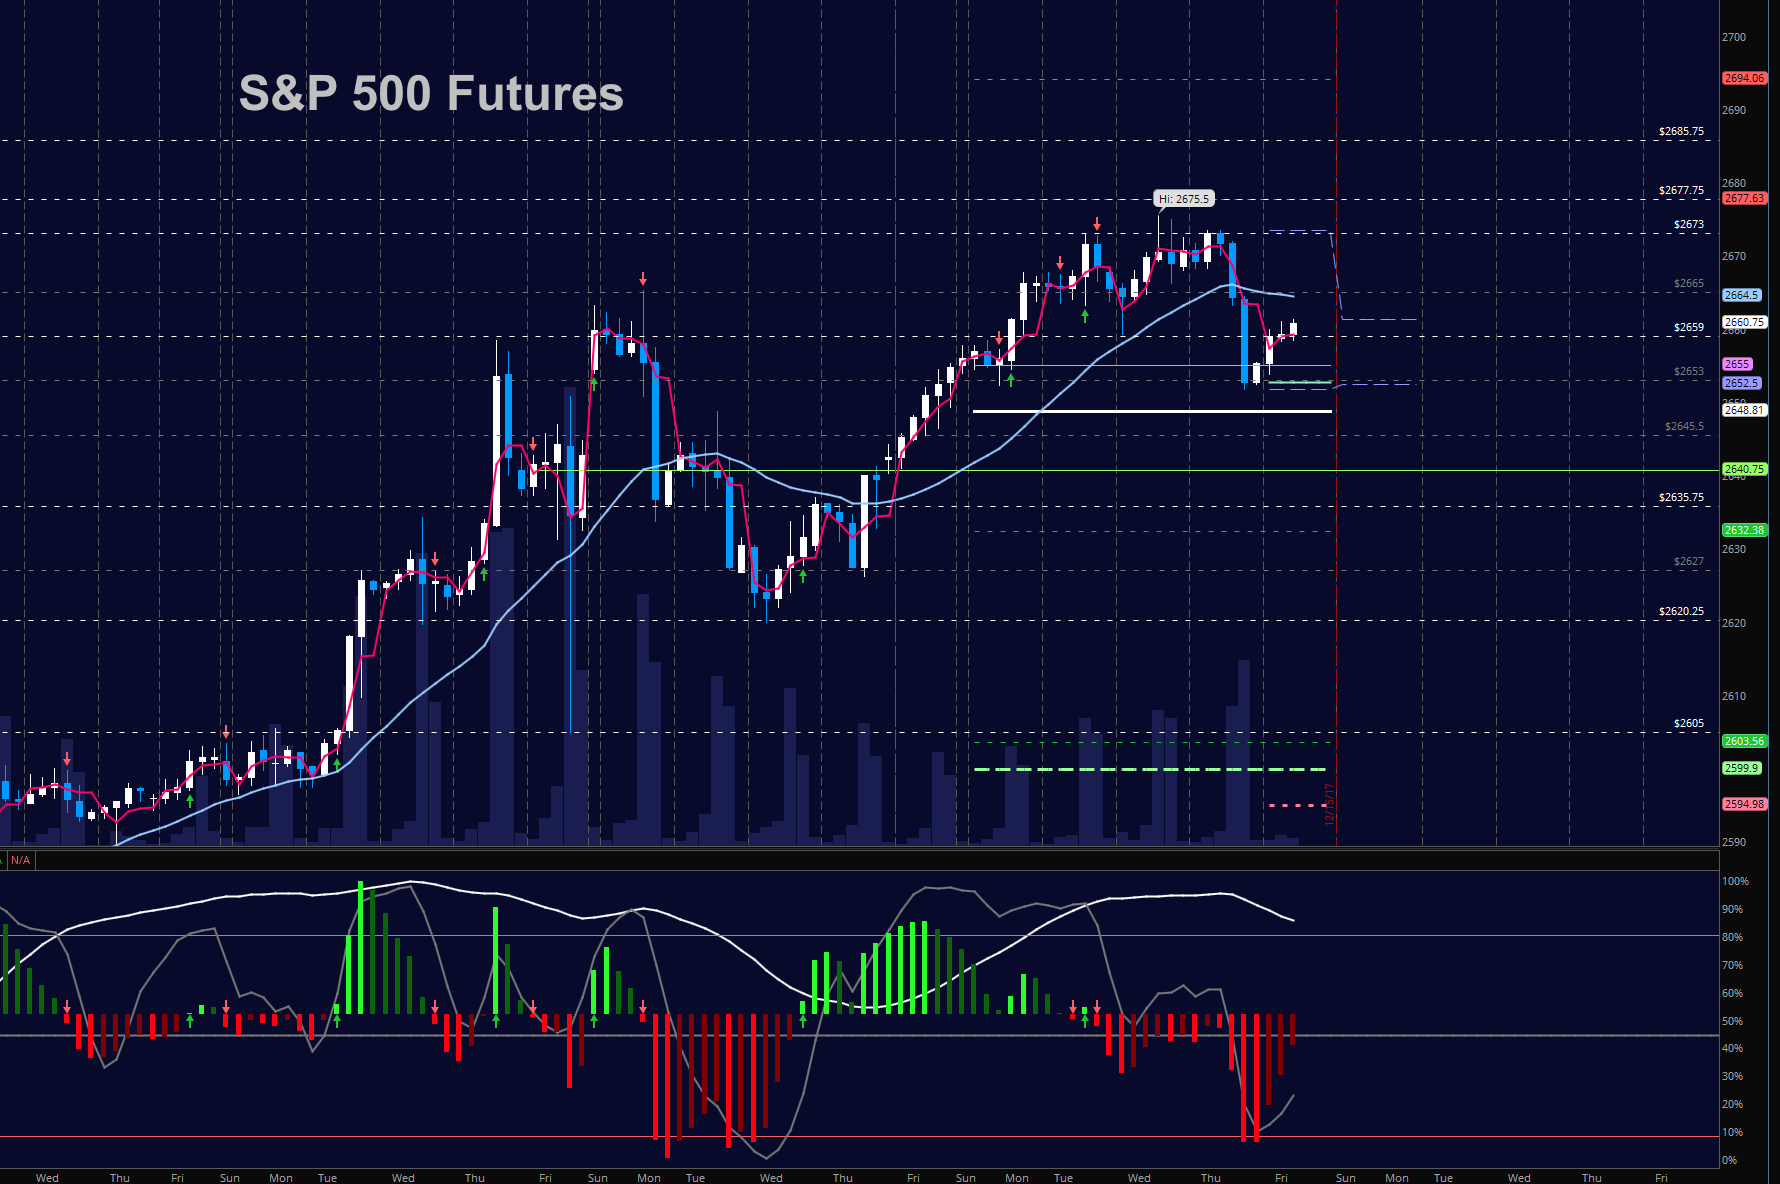
S&P 500 Futures
The fade from yesterday went right into our 2653 level noted on Dec 13. We now have to hold above 2660 to have buyers regain intraday strength. The bullets below represent the likely shift of trading momentum at the positive or failed retests at the levels noted.
- Buying pressure intraday will likely strengthen with a positive retest of 2665.75
- Selling pressure intraday will likely strengthen with a failed retest of 2652.5 (countertrend)
- Resistance sits near 2665.75 to 2674.25, with 2677.75 and 2685.5 above that.
- Support holds between 2652.5 and 2644.75, with 2638.5 and 2627.5 below that.
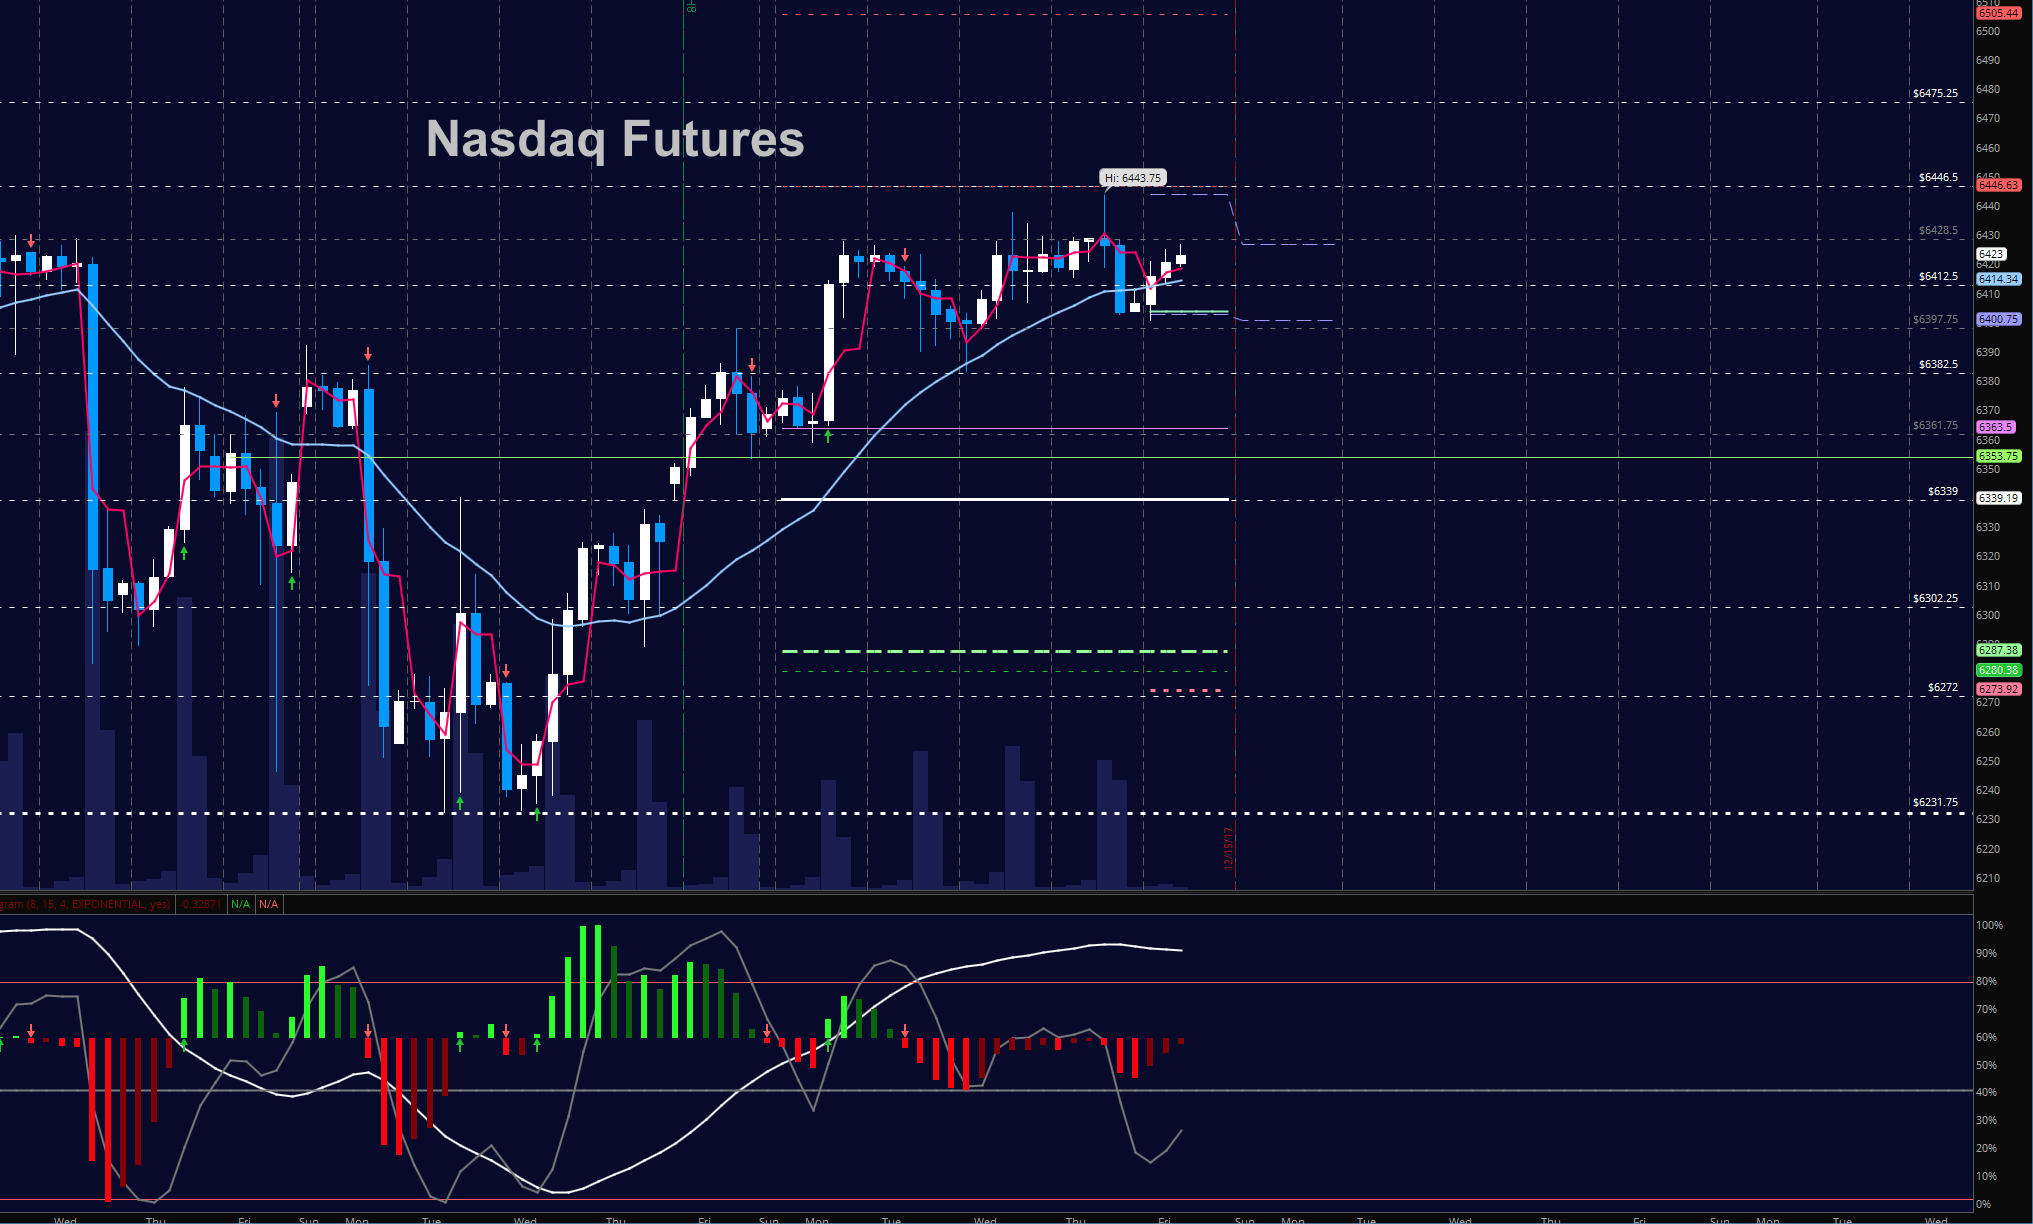
NASDAQ Futures
As traders digested news and took profits from the recent bounce, higher support near 6400 still held and it will be the support level we watch today. Formations are bullish overall. Deep fades should still bring value players to the table but watch resistance for sellers to show up near 6428. The bullets below represent the likely shift of intraday trading momentum at the positive or failed tests at the levels noted –
- Buying pressure intraday will likely strengthen with a positive retest of 6432.5
- Selling pressure intraday will likely strengthen with a failed retest of 6397.5
- Resistance sits near 6427.5 to 6437.5 with 6443.25 and 6475.75 above that
- Support holds near 6400.5 and 6383.75, with 6361.75 and 6339.75 below that.
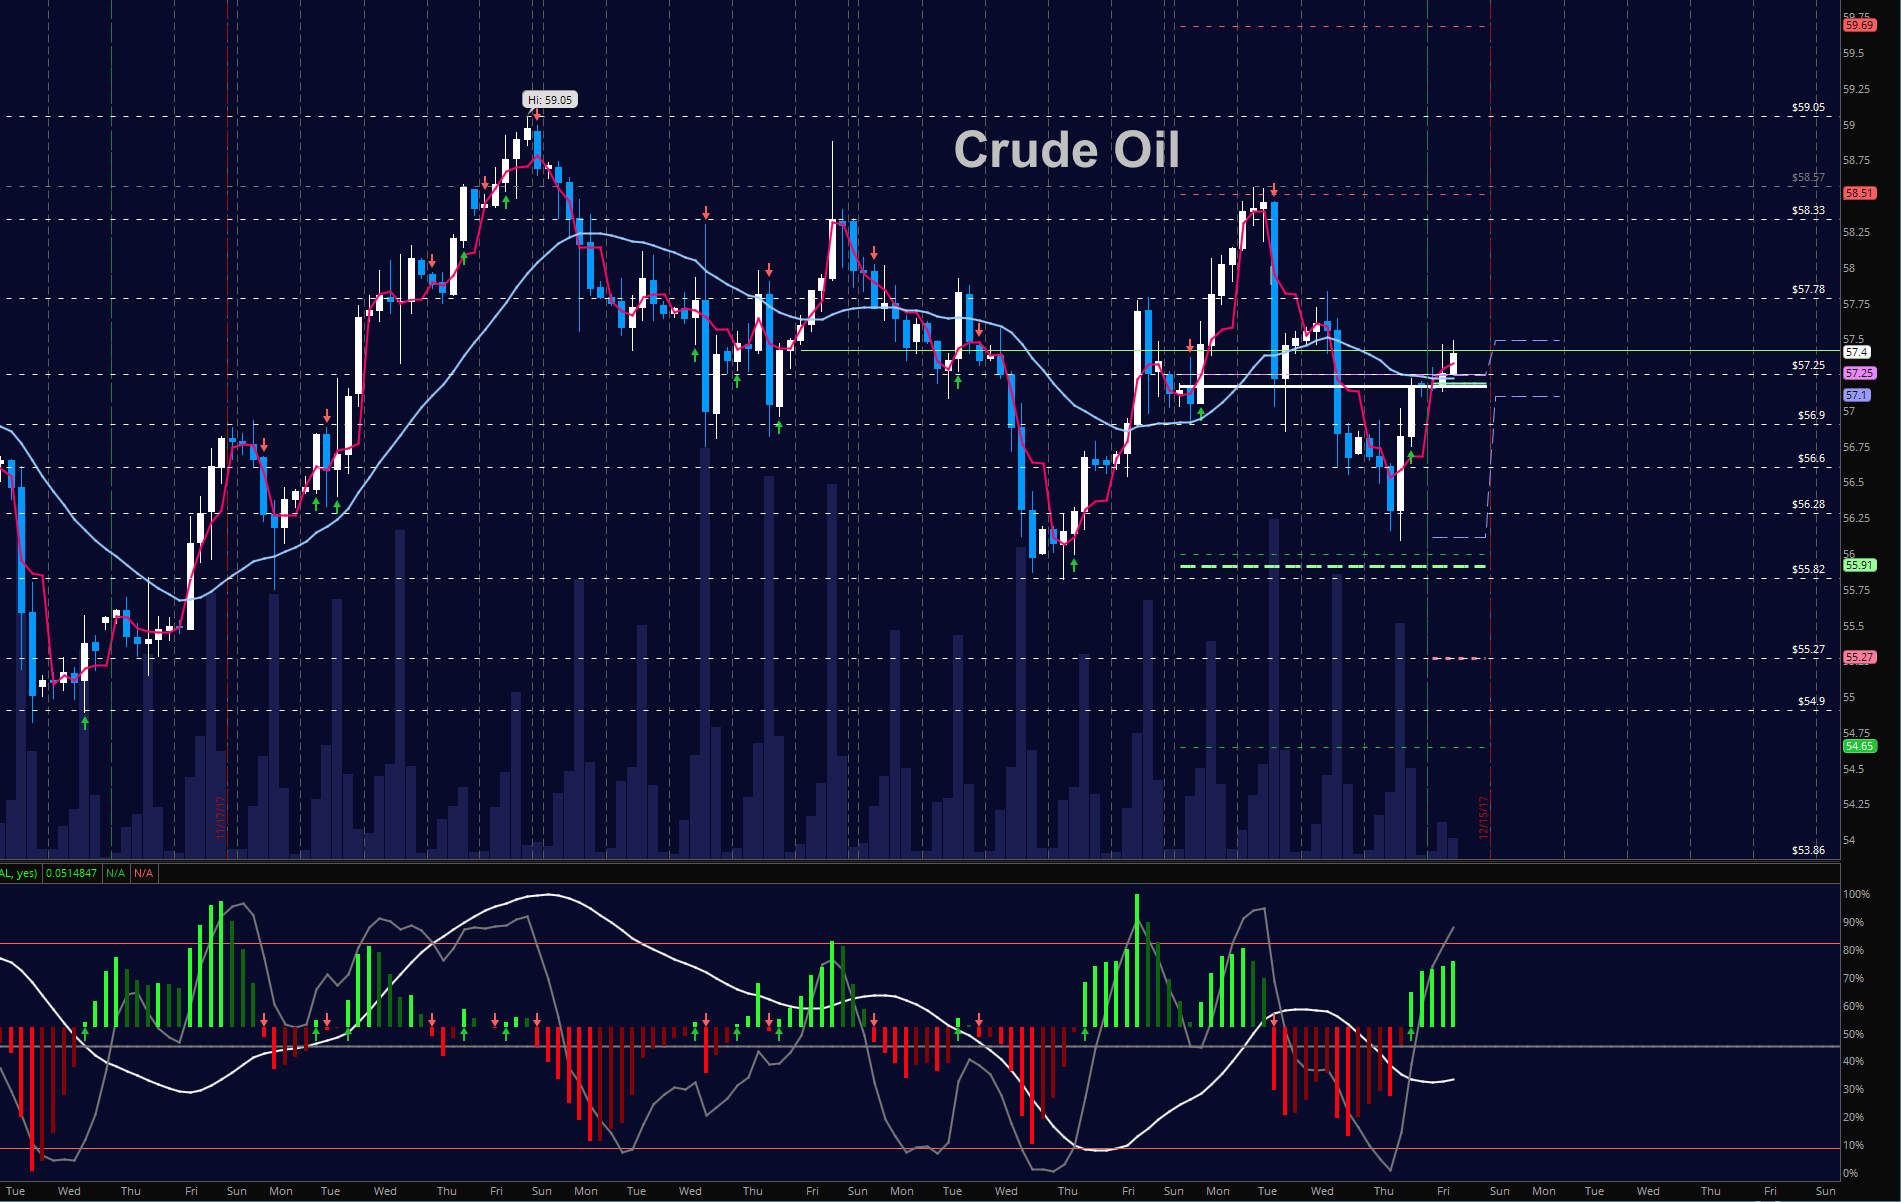
WTI Crude Oil
Traders continue to chop this one around and sellers sent this into deep support yesterday before recovery began midday. Momentum is still messy and we still have a struggle at resistance near 57.4, a step below our old resistance region near 57.7. Ranges are tightening so pay attention to the edges of your formations. The rig count is today and may influence this chart even more. The bullets below represent the likely shift of trading momentum at the positive or failed tests at the levels noted.
- Buying pressure intraday will likely strengthen with a positive retest of 57.59
- Selling pressure intraday will strengthen with a failed retest of 57.04
- Resistance sits near 57.5 to 57.8, with 58.10 and 58.57 above that.
- Support holds near 57.04 to 56.75, with 56.56. and 56.17 below that.
Twitter: @AnneMarieTrades
The author trades stock market futures every day and may have a position in mentioned securities at the time of publication. Any opinions expressed herein are solely those of the author, and do not in any way represent the views or opinions of any other person or entity.


