S&P 500 Futures – Broad Market Overview (August 1st)
A big overnight break just over and into our target from Friday of 2177.25 has resulted in a retreat. Looks like this is setting up a test of the breakout level of 2168.5. Price resistance on S&P 500 futures is between 2174.75 and 2184.5 today, but we could breach into 2187.25 (or even 2190.5). But that would require buyers to become less timid at the breakout. We could still fade back to higher breakout levels with mildly bullish momentum near zero levels. Price support to watch below is 2161.5. But it’s worth noting that we are holding higher overnight lows. The S&P 500 (INDEXSP:.INX) has broken out certainly from the congested region, but charts need to confirm this move before it is all cylinders forward.
See today’s economic calendar with a rundown of releases.
RANGE OF TODAY’S MOTION
S&P 500 Futures Trading Chart (ES_F)
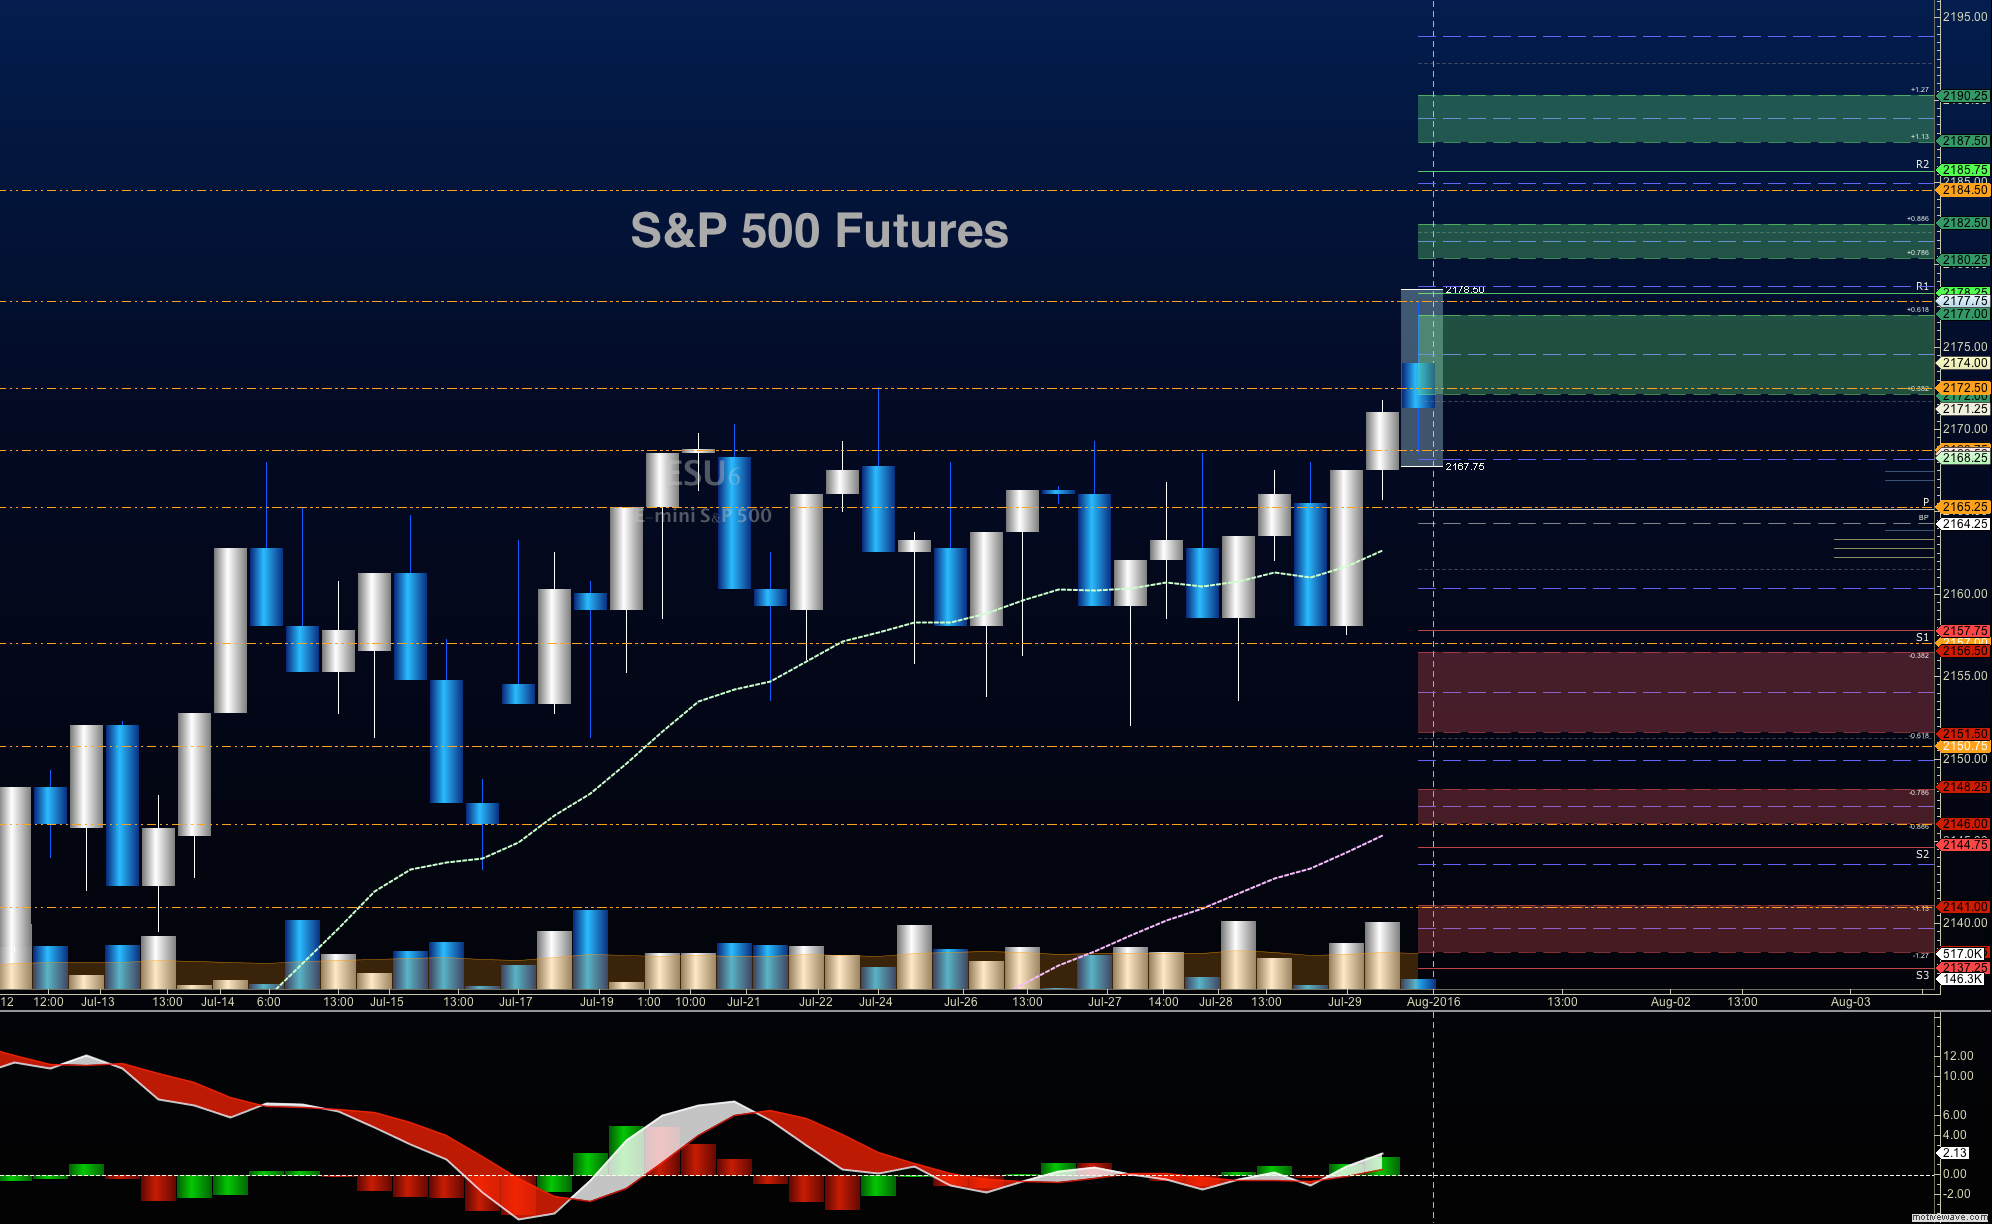
Upside trades on S&P 500 futures – Favorable setups sit on the positive retest of 2172.5, or a positive retest of the bounce off 2168.5 with positive momentum. Remember that the feel of the chart is congestion, so breakouts will be difficult to maintain. I use the 30min to 1hr chart for the breach and retest mechanic. Targets from 2168.5 are 2171.25, 2172.5, 2174.75, 2177.25, 2179.25, 2180.25, and if we expand, we may stretch above into 2184.5 and 2189.75.
Downside trades on S&P 500 futures – Favorable setups sit below the failed retest of 2168 or at the first failed retest of 2172.5 with negative divergence. Keep your eyes on the lookout for higher lows developing intraday. Retracement into lower levels from 2172.5 gives us the targets 2168.5, 2163, 2061.5, 2158.25, 2155.75, 2153.5, 2149.75, 2145.75, and 2143.75 to 2141.5, if sellers take over.
Nasdaq Futures (NQ_F)
The NQ_F rose to an all time high overnight at 4744, but has since retraced into breakout levels near 4730.25. New support rests near 4708, with a lower break into 4692, if sellers gain traction. Resistance levels are now between 4744-4785. Expansions beyond there look like 4890.5. Breaches should retest before any real expansion holds (as the chart did last night, and as it did on Friday, and Thursday before bouncing). Value buyers at support levels have done well over the last few weeks. Today seems to be no different as of this writing.
Upside trades on Nasdaq futures – Favorable setups sit on the positive retest of 4732.75, or a positive retest of 4725.75 with positive momentum. I use the 30min to 1hr chart for the breach and retest mechanic. Watch for the lower high to develop with this range break, if sellers exercise more power intraday. Targets from 4725.75 are 4727.75, 4733.5, 4737.5, 4741, 4744, 4750, and 4759.25, if buyers continue the rally north.
Downside trades on Nasdaq futures – (Countertrend)Favorable setups sit below the failed retest of 4729.5, or at the failed retest of 4737.5 with negative divergence. Retracement into lower levels from 4737.5 gives us the targets 4731.75, 4727.75, 4725.75, 4721.5, 4717.5, 4712.75, 4708.5, 4705.75, 4703, 4698.75, 4693.75, 4691.25, 4687.75, 4682.75, 4678.5, 4664.75, and 4660.5 to 4658.5, if sellers resume control.
Crude Oil
After a failed bounce into 41.88, oil drifted into lower support near 40.90 before traders attempted the bounce currently in progress. Chatter is bearish, so they’ll likely attempt to sell off at resistance levels, but the chart seems to be gaining traction for now. There is a lower level test near 40.46 – if buyers cannot assume control here, and a test of 39.55 below there.
Trading ranges for crude oil should hover between 40.06 and 42.26.
Upside trades on crude oil can be staged on the positive retest of 41.24, or at a bounce off 40.90 with positive momentum. I often use the 30min to 1hr chart for the breach and retest mechanic. Targets from 40.90 are 41.2, 41.43, 41.67, 41.86, 42.16, 42.24, 42.45, 42.78, 42.97, 43.18, 43.3, 43.47, 43.68, 43.83, 44.02, 44.22, 44.49, and perhaps, 44.71, if buyers really take control.
Downside trades on crude oil can be staged on the failed retest of 40.86, or at the failed retest of 41.47 with negative divergence. Targets from 41.47 are 41.28, 41.12, 40.94, 40.73, 40.54, 40.39, 40.14, and perhaps 39.85.
If you’re interested in watching these trades go live, join us in the live trading room from 9am to 11:30am each trading day. It is now primarily stock market futures trading content, though we do track heavily traded stocks and their likely daily trajectories as well – we begin at 9am with a morning report and likely chart movements along with trade setups for the day. Visit TheTradingBook.com for more information.
As long as the trader keeps himself aware of support and resistance levels, risk can be very adequately managed to play in either direction as bottom picking remains a behavior pattern that is developing with value buyers and speculative traders.
Twitter: @AnneMarieTrades
The author trades stock market futures every day and may have a position in mentioned securities at the time of publication. Any opinions expressed herein are solely those of the author, and do not in any way represent the views or opinions of any other person or entity.


 Trading Into Inflection Point")
