Broad Stock Market Outlook for February 16, 2018
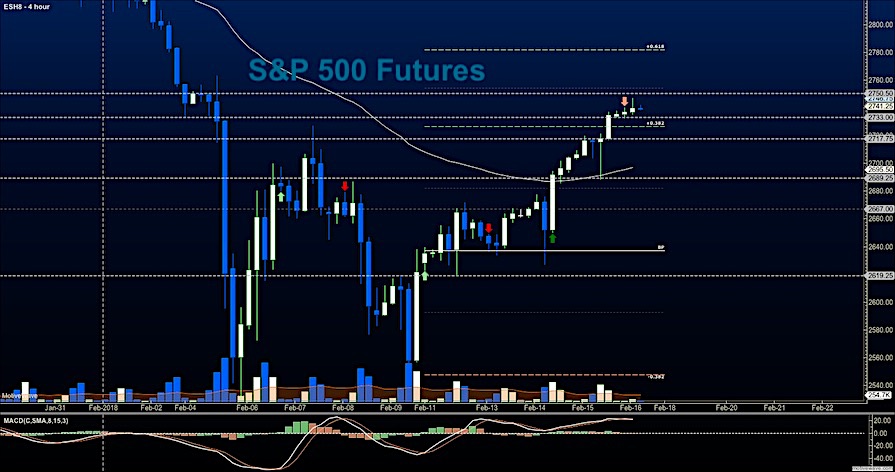
Buyers remain in control after making a higher low on yesterday’s dip. That dip saw S&P 500 futures hit 2688 – quite near our level of 2684 – and reverse higher.
We’ll need to see how well we hold 2697 today as support. Watching support levels as we expand upward still remains our best bet for solid and low-risk entry as our charts keep a positive drift.
S&P 500 Futures
Price resistance sits near 2750 this morning after the moves higher premarket. Holding higher support regions near 2687 to 2697 keeps buyers in control (from a swing perspective). Keep your eyes open for a failure to test higher highs, as this will signal slowing from the sellers and strengthening from the buyers. Buying the pullbacks will continue to be the best bet – watch for support action to continue to hold as breaks here will signal more selling pressure. The bullets below represent the likely shift of trading momentum at the positive or failed retests at the levels noted.
- Buying pressure intraday will likely strengthen with a positive retest of 2744.5
- Selling pressure intraday will likely strengthen with a failed retest of 2731
- Resistance sits near 2742 to 2744.5, with 2756.75 and 2762.5 above that.
- Support sits between 2732.5 and 2717.75, with 2701.25 and 2687.5 below that.
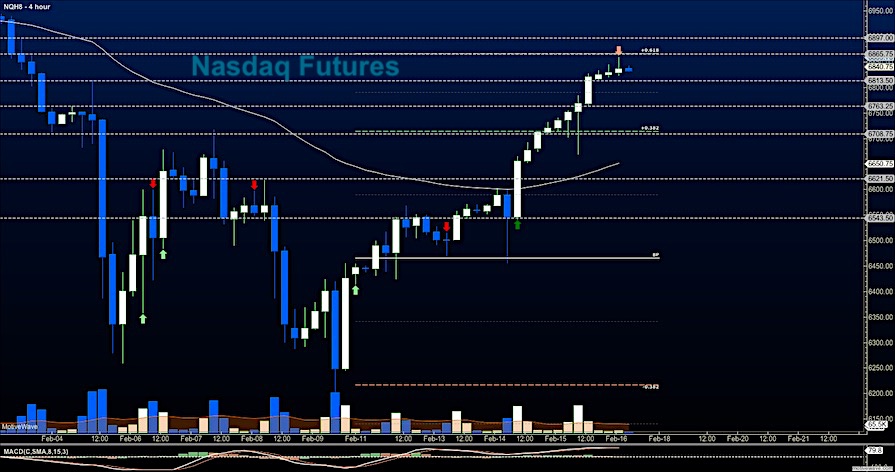
NASDAQ Futures
Momentum holds positive as traders recover from a deep dip yesterday and are fading off the highs made this morning. Selling pressure sits near 6860 this morning as traders retreat from the highs earlier but buyers will be waiting at the ready for a first pass bounce near 6813. The bullish trend remains intact- support watch will be important today as we continue to be extended. As with the ES_F, watch for the failure to breach higher highs for tests of support to be on the horizon. The bullets below represent the likely shift of intraday trading momentum at the positive or failed tests at the levels noted.
- Buying pressure intraday will likely strengthen with a positive retest of 6844.5
- Selling pressure intraday will likely strengthen with a failed retest of 6812
- Resistance sits near 6844 to 6865.25 with 6871.5 and 6923.5 above that.
- Support sits between 6823.5 and 6809.5, with 6794.5 and 6705.5 below that.
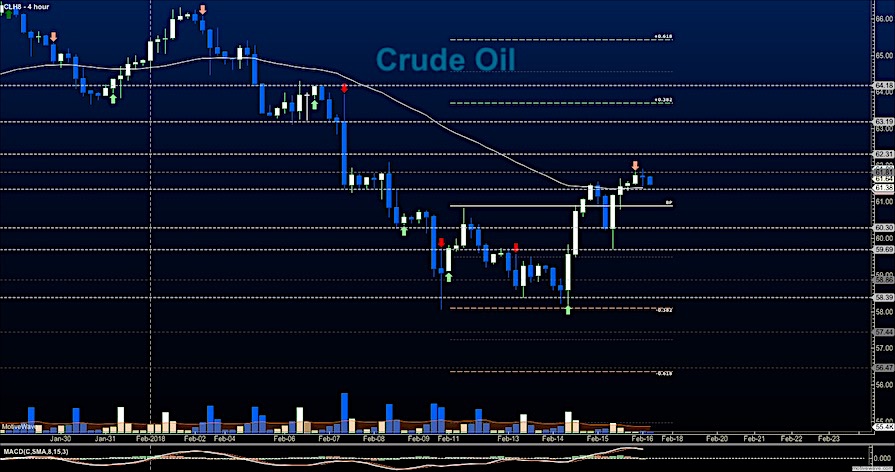
WTI Crude Oil
CL_F – Traders continue to buy the charts into resistance zones and are now stalled near 61.8. Breaching this region puts us with targets near 63 to 63.7 before the current cycle is finished. Support still sits near 59.7. Holding the region near 60.3 makes for bullish strength across the board. The bullets below represent the likely shift of intraday trading momentum at the positive or failed tests at the levels noted.
- Buying pressure intraday will likely strengthen with a positive retest of 61.84
- Selling pressure intraday will strengthen with a failed retest of 60.8
- Resistance sits near 61.8 to 62.3, with 63.19 and 64.01 above that.
- Support holds near 60.83 to 59.57, with 58.86 and 57.44 below that.
Twitter: @AnneMarieTrades
The author trades stock market futures every day and may have a position in mentioned securities at the time of publication. Any opinions expressed herein are solely those of the author, and do not in any way represent the views or opinions of any other person or entity.

: Creating Bullish Divergence?")

: Creating Bullish Divergence?")


