S&P 500 Futures Trading Chart and Price Analysis – September 25
MARKET COMMENTARY
Another deep dip in a stock market that looks increasingly weaker amid news of one thing or another.
Overnight bounces did not hold – another tell, and a weak line of support buyers hold the region near 2960.
Some broad based selling but buyers still sit by looking for opportunities to engage with limited risk.
Dislocated markets remain and these swings on lighter volume and heavier volume fail to confirm direction- which means we are still rangebound but with a bit more bearish risk. Market volatility remains a concern.
WEEKLY PRICE ACTION
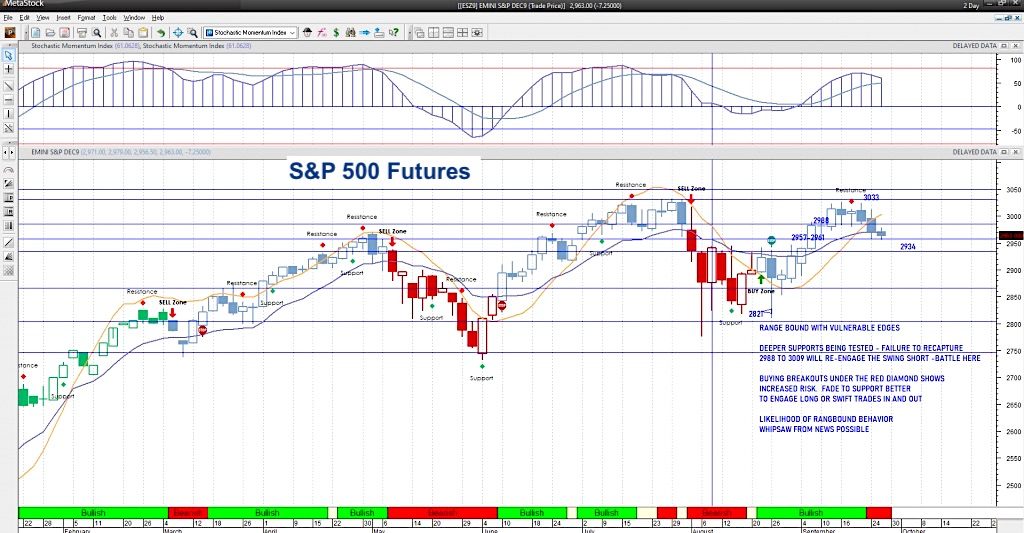
Price support is now resistance after two days of failed bounces – last week’s levels – 2984 -with 2991 above that mark the resistance levels to breach. Neutral to negative action is now present. However, if we look at bigger pictures, all the watched indices are still in breakout formations. This makes for a messy patch of trading.
The weekly charts continue to show flattening momentum. The line in the sand today is 2991.75 – above this zone, buyers will be more brave. Sellers hold the upper hand below 2957.
COMMODITY & CURRENCY WATCH
Gold prices hold well above breakout areas near 1514. Holding above 1538 bring the test of 1565 right into view. Pullbacks remain active buy zones. The US dollar is holding its upside above 98 for an extended period of time giving it more lift. WTI was trying to stabilize above 58 but could not and after the API showed a build when everyone was expecting a draw, traders have pushed prices right back into the 56 area as fears of global slowing continue.
TRADING VIEW & ACTION PLAN
Buyers are struggling near 2962- an approximate support region. Even as deep pullbacks are still the best places to engage if risk exposure is your primary concern (and this is always my concern) – sellers are now trying to hold control of the charts. Follow the trend in the shorter time frames and watch the price action.
The theme of motion is NEGATIVE AS LONG AS WE HOLD BELOW 2978 today. Do what’s working and watch for weakness of trend.
Twitter: @AnneMarieTrades
The author trades stock market futures every day and may have a position in mentioned securities at the time of publication. Any opinions expressed herein are solely those of the author, and do not in any way represent the views or opinions of any other person or entity.
: Creating Bullish Divergence?")

 and Semiconductors (SMH): Concerning Price Pattern?")
 and Semiconductors (SMH): Concerning Price Pattern?")


