Outlook for Feb 22 – The S&P 500 futures have been rallying higher since yesterday evening but have plateaued since testing 1938.75. Momentum is currently positive but pullbacks into support are very likely. Buyers need to defend lower support zones or else we’ll chop back down into 1904-1907.
A bounce off 1919, or a hold at the test of 1922, gives us more expansion and opens up the possibility of a rally on S&P 500 futures up to 1944.25 and 1946.5.
Momentum on the four hour chart is mixed, but holding in positive trending territory – suggesting drifts into support that are likely to hold. S&P 500 futures daily charts read momentum as trending positive, but still in negative trending territory – suggesting bounces into resistance. Moving averages present good opportunities for buyers off support tests.
Shorter time frame momentum indicators are sitting in positive territory and trending up, but divergent formations are present. Positive divergence is taking hold in longer time frames for now.
See today’s economic calendar with a rundown of releases.
THE RANGE OF TUESDAY’S MOTION
Crude Oil Futures (CL_F)
Outlook for Feb 22 – Crude Oil futures are bouncing after the gap fill of the contract roll. Momentum and trend show bounce action possible but the chart is sitting at relative resistance – 33.25
Today, the trading ranges are between 31.3 and 33.25.
Moving averages in oil are mixed across longer intraday time frames across the board. Four hour time frames show moving averages in both directions, with positive momentum beneath that is waning.
Intraday long trading setups on crude oil futures suggest a long off 32.1 bounce, or 33.25 breach or retest into 33.4, 33.6, 34.07, and if buyers hold on, we’ll see 34.4 to 34.7.
Intraday short trading setups suggest a short below a 33.1 failed retest or a failed retest of 32.47 with negative divergence showing sends us to 32.25, 32.02, 31.89 and 31.64.
E-mini S&P 500 Futures (ES_F)
Below is a S&P 500 futures chart with price support and resistance trading levels for today. Click to enlarge.
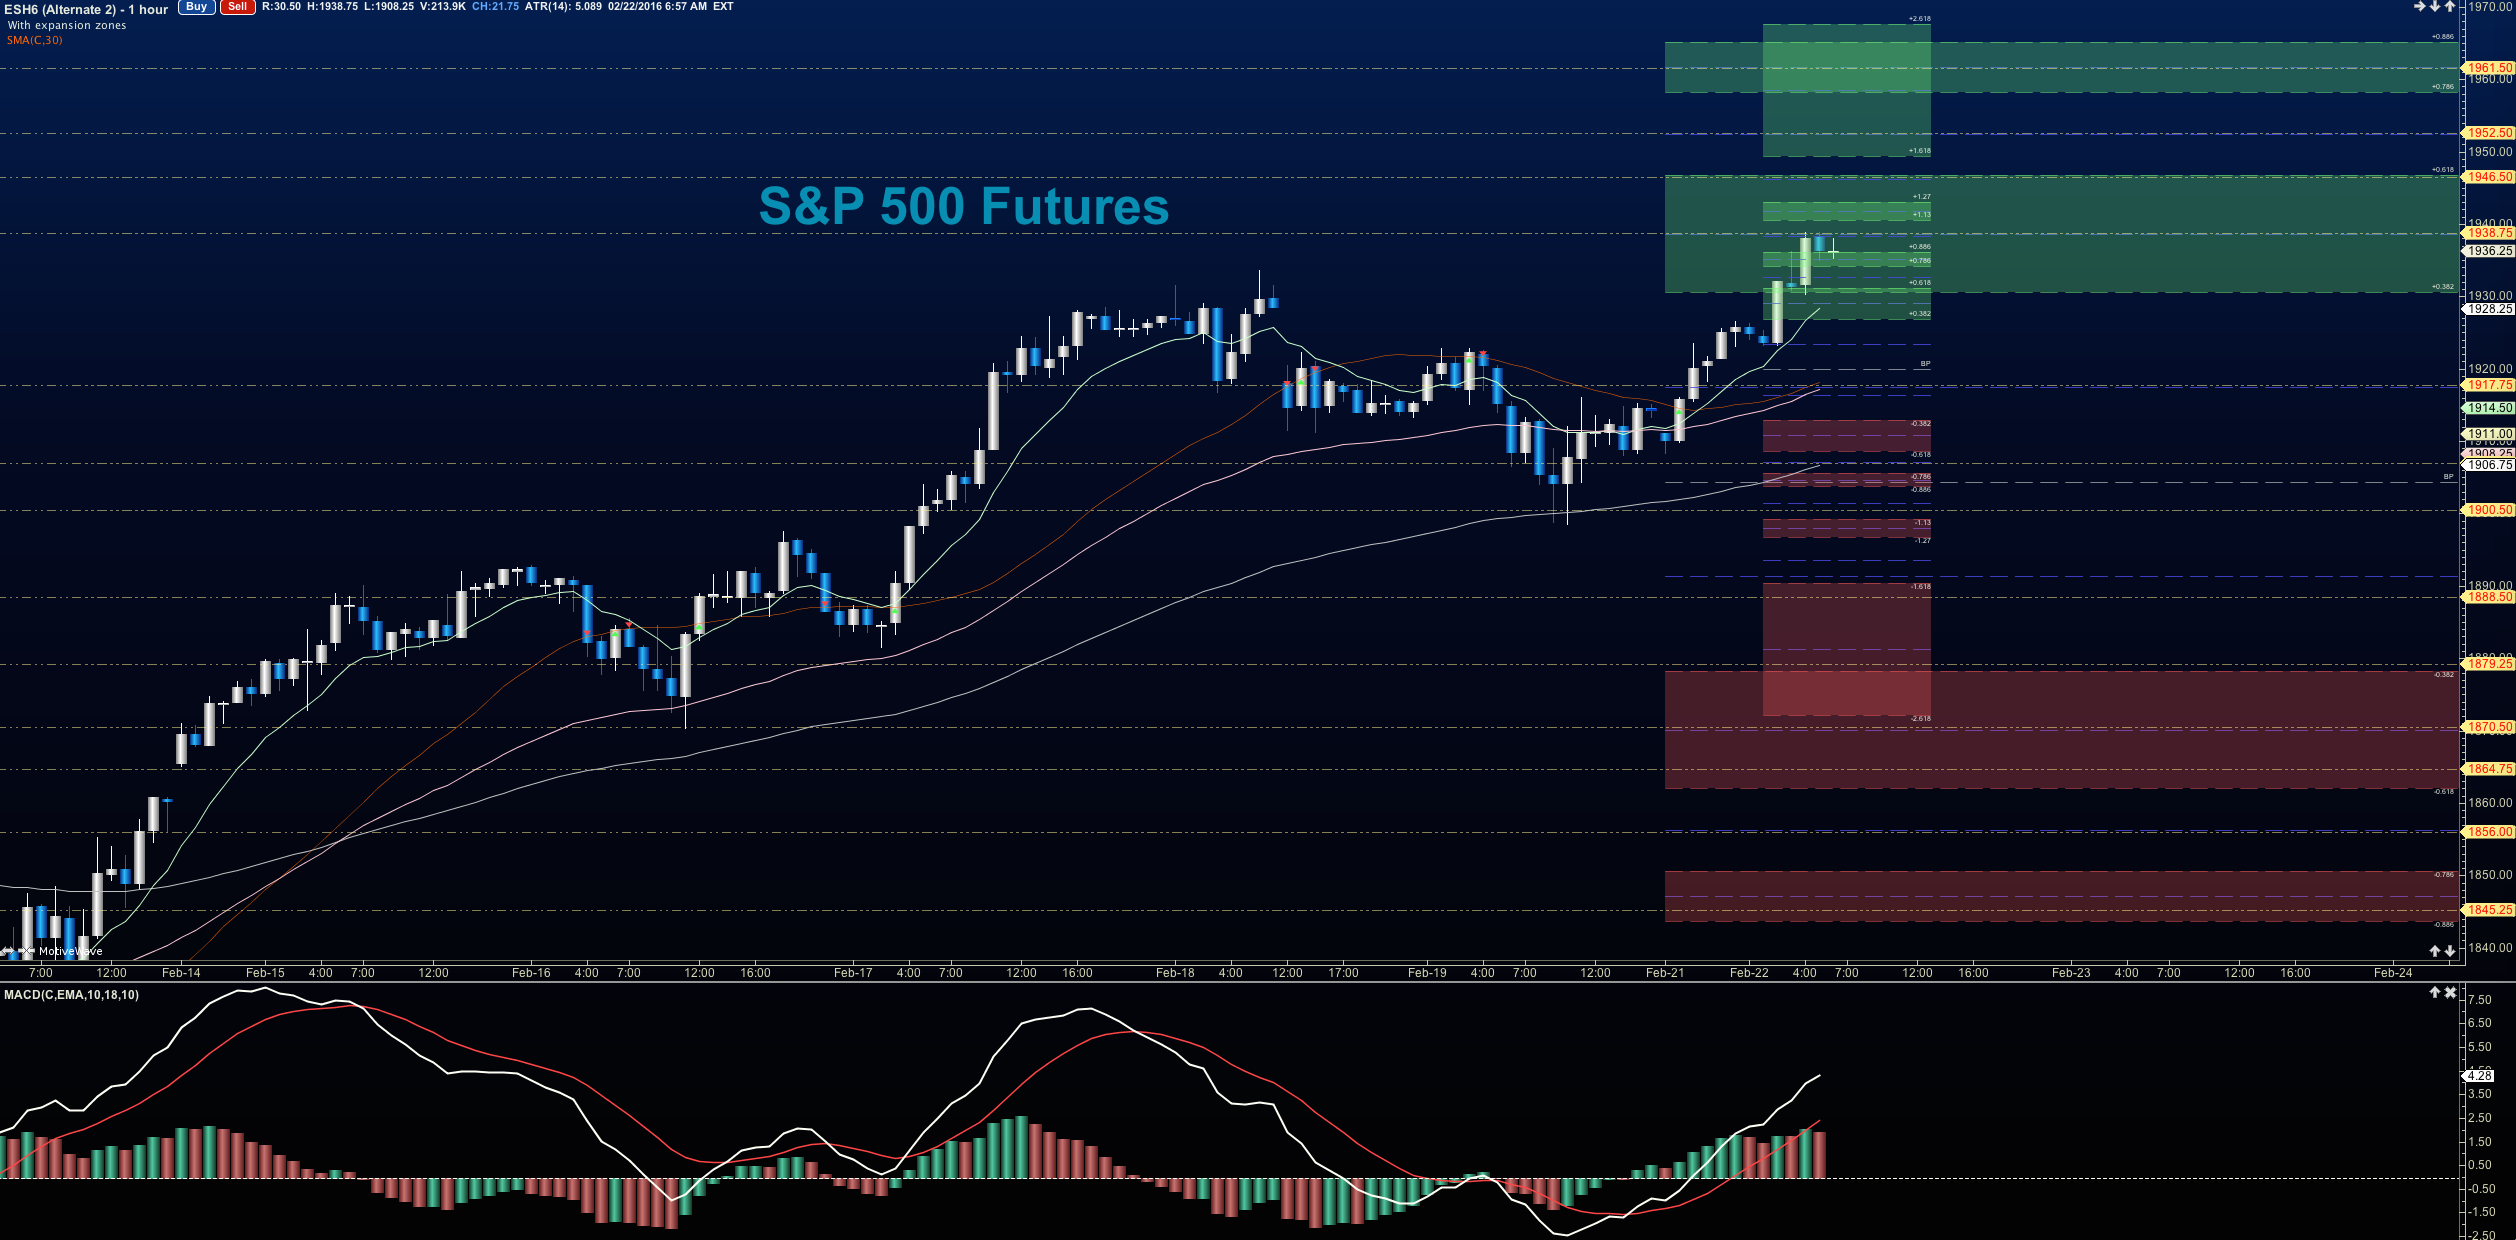
Outlook for Feb 22 – S&P 500 futures price support has been established near 1904-1907. Congestion currently sits at 1911-1917. The level to retest and hold today will be 1931. If S&P 500 futures get over that charts should hold and move into resistance above.
Upside motion has the best setup on the positive retest of 1921.75 (watch momentum here; it may have trouble near 1931.5)- or a retest of 1936 after expansion above 1936.75. Targets from 1936 are 1937.75, 1941.5, 1944.25, 1946.5 and if we can catch a bid there, we could expand into 1950-1952. Big resistance test sits at the region between 1961-1964. Watch the higher lows to keep you on the right side of the long trade. Charts look quite weak here but the undercurrent long needs to be considered. This care of attention to the undercurrent on Friday allowed us to consider a long that is holding today.
Downside motion opens below the failed retest of 1931.25 or at the failed retest of 1936 with negative divergence. Retracement into lower levels from 1931.25 gives us the targets 1929.25, 1926.75, 1921.5, 1917.75, 1916, 1912.25 and perhaps 1904.75. If buyers do not provide support there, we’ll see the familiar 1897 – 1894 levels once more. The undercurrent looks like buyers will step in a pullbacks so pay attention to higher lows that may develop.
Have a look at the fib levels marked in the blog for more targets.
If you’re interested in the live trading room, it is now primarily stock market futures content, though we do track heavily traded stocks and their likely daily trajectories as well – we begin at 9am with a morning report and likely chart movements along with trade setups for the day.
As long as traders remain aware of support and resistance levels, risk can be very adequately managed to play in either direction as bottom picking remains a behavior pattern that is developing with value buyers and speculative traders.
Twitter: @AnneMarieTrades
The author trades stock market futures every day and may have a position in mentioned securities at the time of publication. Any opinions expressed herein are solely those of the author, and do not in any way represent the views or opinions of any other person or entity.


