Stock market futures continue to expand higher into resistance. The S&P 500 futures sit just above the 1877 support. Now the levels to watch are between 1877-1880. There is definitely a battle there.
Recapturing and breaching 1884 will bring buyers back to the table and send us to 1897, 1905 and possibly 1912. Else we’ll give back quite a bit of this move into 1873 and perhaps even 1865 on S&P 500 futures.
The Morning Report: Futures Rise Into Resistance
Intraday resistance sits near 1894.5. Intraday support sits at 1877. Congestion is near 1884. Momentum is positive but drifting into support levels. Our hyperextension from moving averages on longer time frames has continued to allow these big bounces.
Shorter time frame momentum indicators are sitting in positive territory and trending down. Longer cycles are downward trending and flattening in negative territory. Positive divergence is taking hold in longer time frames.
See today’s economic calendar with a rundown of releases.
THE RANGE OF TUESDAY’S MOTION
Crude Oil Futures (CL_F)
News about crude oil production levels and possible deals have oil expanding into higher resistance levels before rejecting sharply. Overnight formations now hold 31.53 as resistance and 29.54 as support.
Today, the trading ranges for crude oil are between 30.15 and 29.54. Traders seem eager to buy but the market has been jagged with quick moves.
Moving averages for crude oil are mixed across longer intraday time frames across the board. Hourly time frames show positive sloping moving averages with negative divergence underneath, suggesting support tests before bounce action continues.
Intraday long trading setups for crude oil prices suggest a long off 30.16 retest or 29.54 (with momentum showing positive, else that brings a lower high) into 30.62, 30.92, 31.4, 31.73, and if we get squeezed here, we’ll see 32.7 on the bounce event.
Intraday short trading setups for crude oil prices suggest a short below a 29.5 failed retest or a failed retest of 30.6 with negative divergence showing sends us to 29.04, 28.56 and 28.35.
Have a look at the fibonacci levels marked on my blog for more price targets.
E-mini S&P 500 Futures (ES_F)
Below is a S&P 500 futures chart with price support and resistance trading levels for today. Click to enlarge.
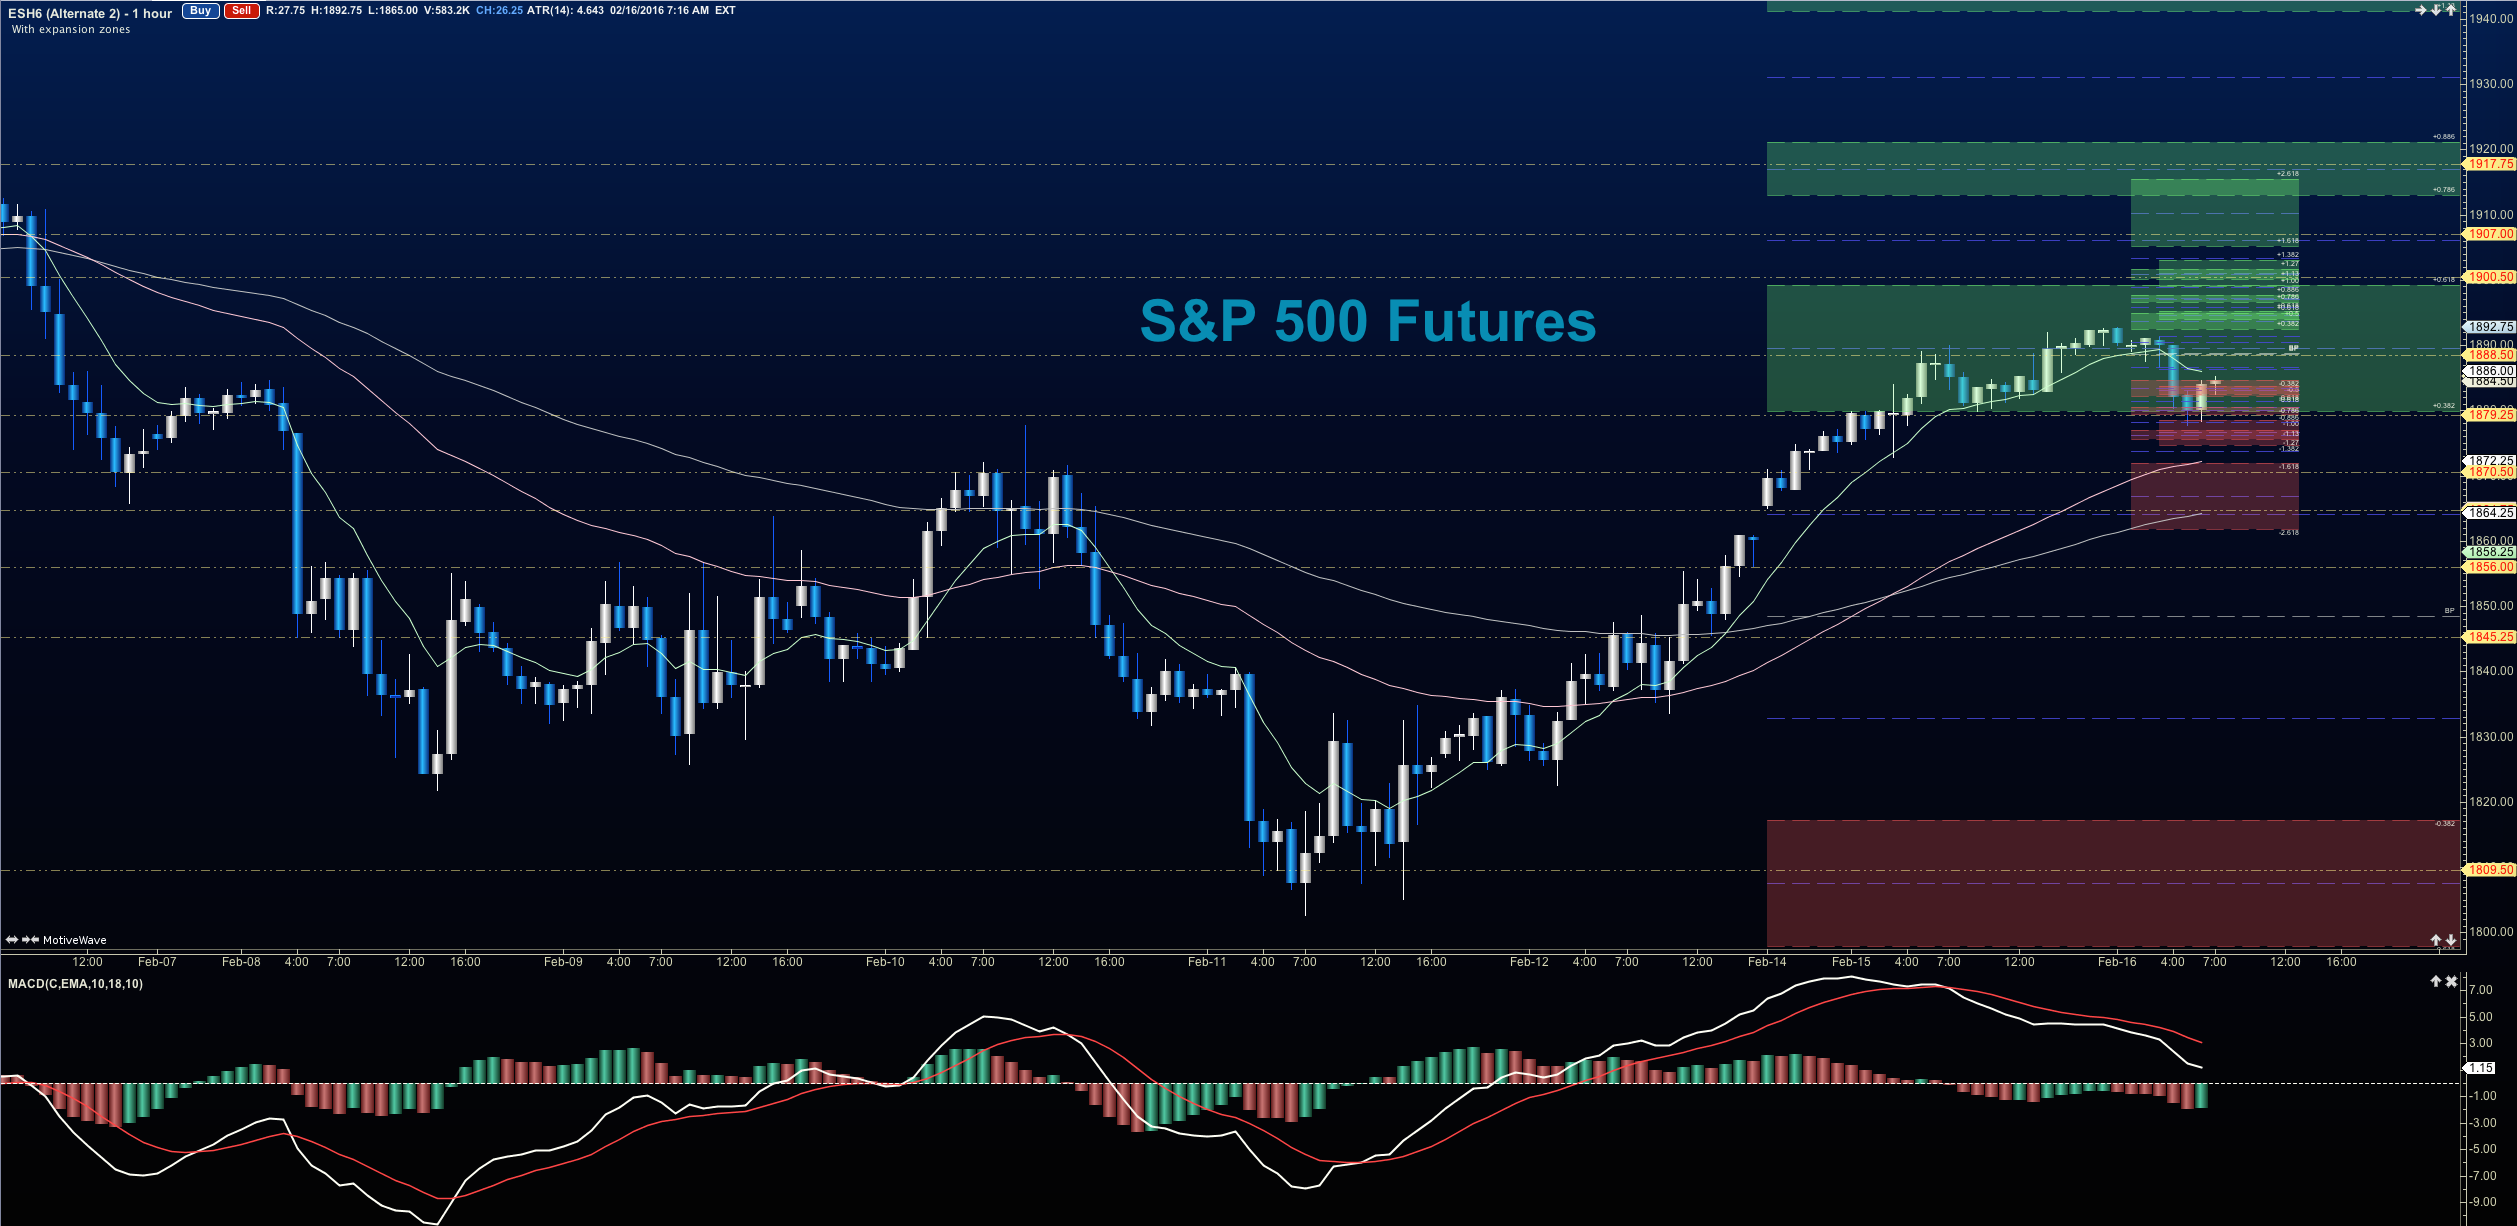
After a very big bounce, S&P 500 futures now sit at old resistance areas trying to establish them as new support – 1880-1884.
Upside motion has the best setup on the positive retest of 1878 (watch momentum here)- or a retest after expansion above 1884.5. Targets from 1884.5 are 1889, 1892, 1894, 1897, and if we can catch a bid there, we could see the S&P 500 futures expand into 1904-1912. Big resistance test sits at the region between 1904-1912. Watch the higher lows to keep you on the right side of the long trade. Expansions upside over the longer term could see 1942 to 1960, but that certainly seems extremely unlikely today as the chart seems exhausted at the moment.
Downside motion opens below on a failed retest of 1892 or at the failed retest of 1878. Retracement into lower levels from 1878 gives us the targets at 1873.75, 1870.5, 1865.5, 1863.5, 1860 and perhaps 1856.5. If buyers do not provide support there, we’ll see the familiar 1850 level once more.
Have a look at the fibonacci levels marked on my blog for more S&P 500 futures targets.
If you’re interested in the live trading room, it is now primarily stock market futures content, though we do track heavily traded stocks and their likely daily trajectories as well – we begin at 9am with a morning report and likely chart movements along with trade setups for the day.
As long as traders remain aware of support and resistance levels, risk can be very adequately managed to play in either direction as bottom picking remains a behavior pattern that is developing with value buyers and speculative traders.
Twitter: @AnneMarieTrades
The author trades stock market futures every day and may have a position in mentioned securities at the time of publication. Any opinions expressed herein are solely those of the author, and do not in any way represent the views or opinions of any other person or entity.


