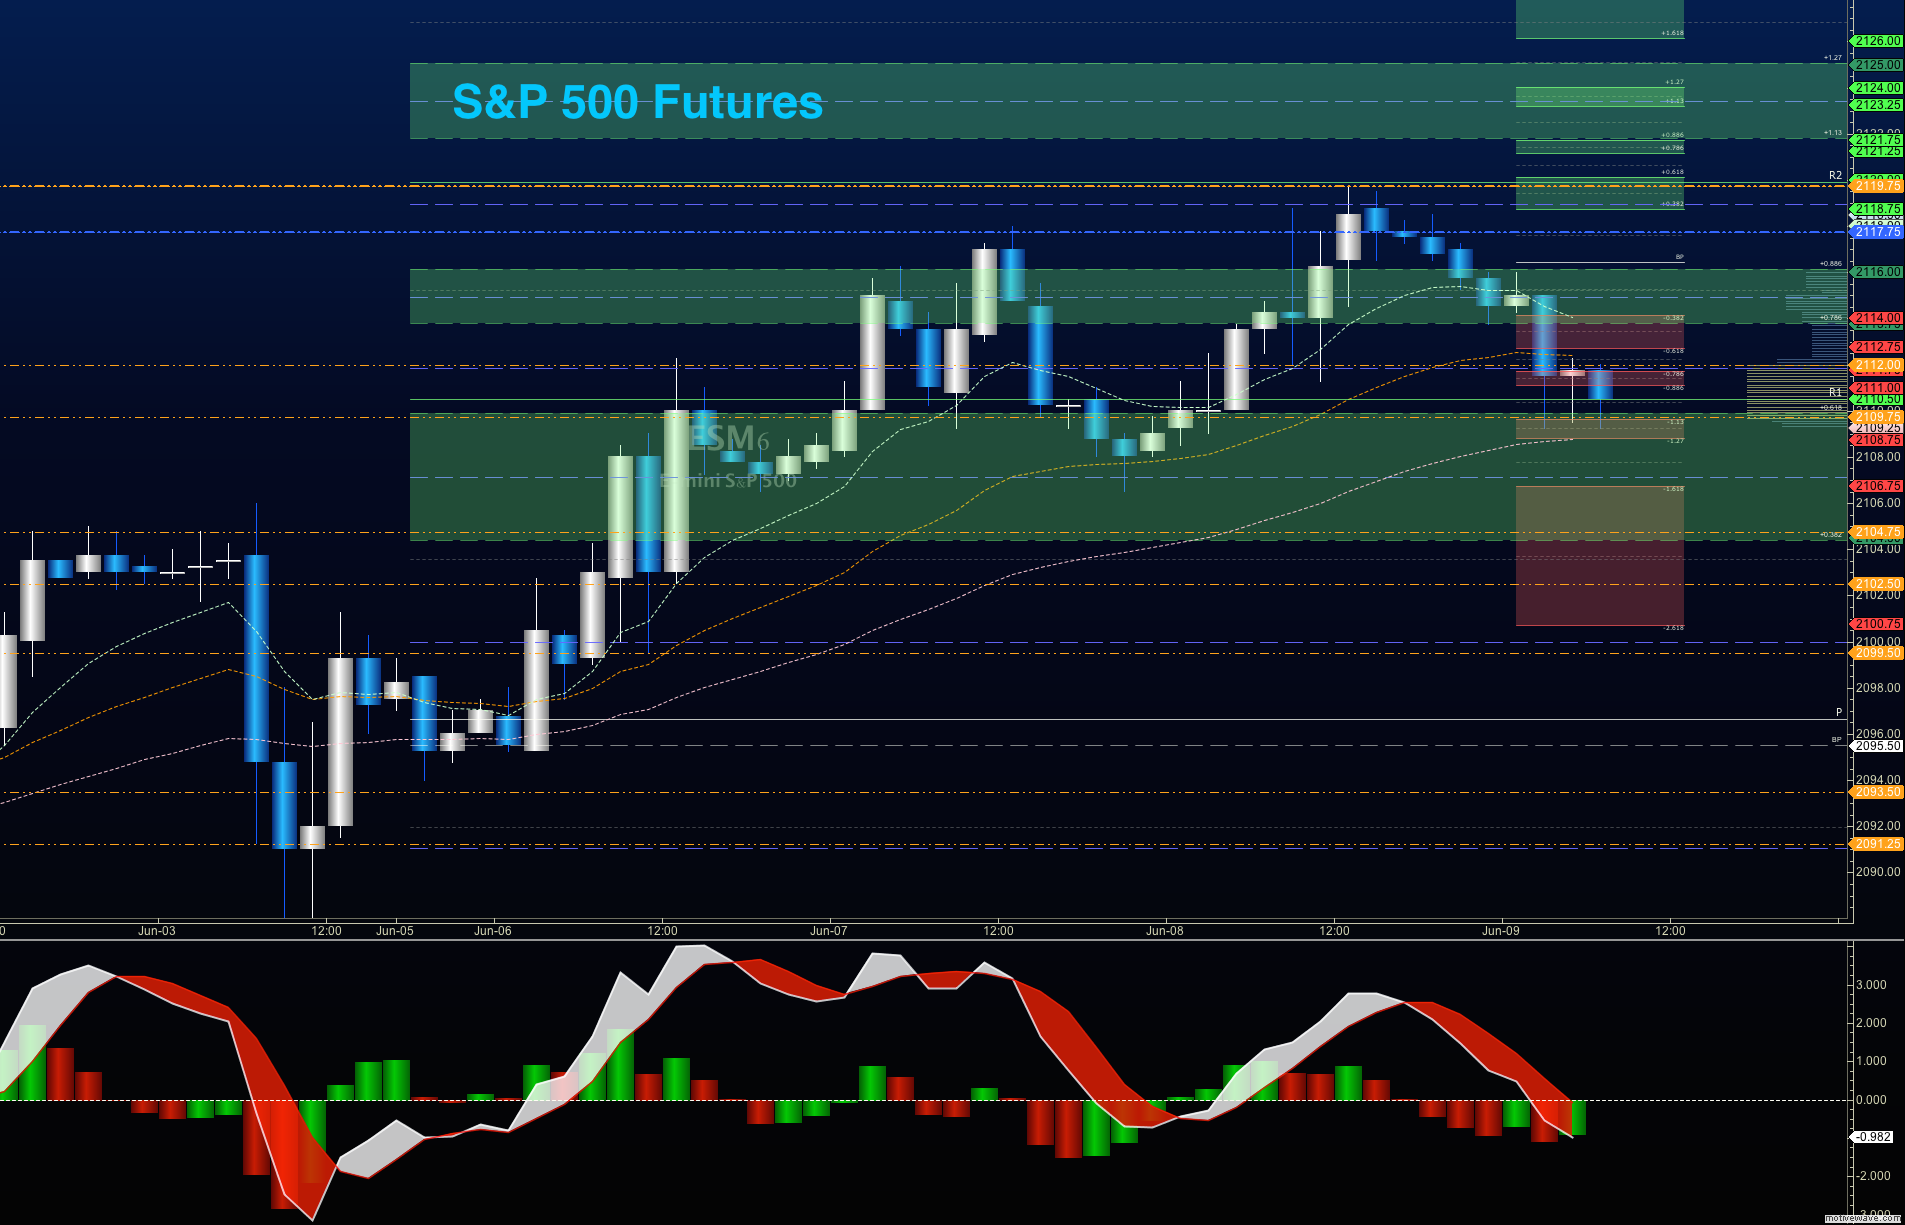
S&P 500 futures outlook for June 9 – Another high sold off overnight, but charts have held higher supports as expected. The damp momentum allows us to anticipate the selloff as we stretch higher. Buying off support bounces continues to hold the least risk, but it is now important to watch for lower highs across stock market futures indices.
I suspect we move in a sideways pattern for the next couple of weeks into the major economic decisions coming. Overhead trading levels on S&P 500 futures are 2118.75 to 2120.25 – they remain resistance regions today. I still do not see major range expansion here, and it has been clear that any range expansions should be sold into higher support. Support today looks like 2104.5 – 2102.5. Below 2109, charts become more vulnerable to selling pressure.
See today’s economic calendar with a rundown of releases.
THE RANGE OF TUESDAY’S MOTION
E-mini S&P 500 Futures (ES_F)
S&P 500 Futures Outlook for June 9, 2016 –
Upside trades on S&P 500 futures (ES_F) – Favorable setups sit on the positive retest of 2113.25, or a positive retest of 2106.5 with positive momentum. I use the 30min to 1hr chart for the breach and retest mechanic. Targets from 2106.5 are 2109, 2111.25, 2113.5, 2115.25, 2116.5, 2118, and perhaps 2119.5, and 2120.25, if power remains with the buyers. Still seeing a bit of divergent momentum. I will be watching for failed bounces, with return to higher lows as we have seen, with an extra watch for a lower high or even a dip lower than expected. Momentum remains weak.
Downside trades on S&P 500 futures – Favorable setups sit below the failed retest of 2108.5 or at the failed retest of 2113 with negative divergence. It is important to watch for higher lows to develop with the 2113 entry, if the strength of motion holds with the buyers. Retracement into lower levels from 2113 gives us the targets 2110.5, 2109.5, 2108, 2106, 2104.75, 2101.5, 2099.5, 2096.25, 2094.25, 2092.5, 2090.5, and perhaps back to 2082.5.
Have a look at the Fibonacci levels marked in the blog for more targets.
Nasdaq Futures
Outlook for Nasdaq Futures (NQ_F) for June 9, 2016 – The NQ_F continues to perform more weakly than the ES_F, and is sitting at lower support. Significant overhead supply continues to sit between 4543 and 4564. Weak momentum continues, and now in neutral territory. Bearish action has been amplified below the failed retest of 4511, and the failure to recapture 4504 will leave us vulnerable to sellers taking control for the day. There should still be bounce action, but only into resistance. Buyers will be emboldened above 4522.5, but resistance again will make advancing to new weekly highs a bit tough.
Upside trades on Nasdaq futures – Favorable setups sit on the positive retest of 4508.5, or a positive retest of 4497.5 with positive momentum. I use the 30min to 1hr chart for the breach and retest mechanic. Watch for the lower high to develop in the long opening at 4497.5, and sellers to force the chart down, if sellers take hold near the 4504.5 test from below. Targets from 4497.5 are 4502.25, 4506.5, 4508.5, 4511.75, 4514.25, 4517.5, 4520.25, 4524.5, 4529.25, 4534.5, 4538.75, 4543.75, 4550.75, 4554.5, and 4560.25. Range expansions above here should fail under the negative divergence, but could stretch into 4564-4578, but that seems very unlikely at this time.
Downside trades on Nasdaq futures – Favorable setups sit below the failed retest of 4502 or at the failed retest of 4514.75 with negative divergence. Retracement into lower levels from 4514.75 gives us the targets 4512.5, 4508.5, 4504.5, 4502.25, 4497.5, 4479.5, 4472.25, 4464.75, 4451.25, and perhaps 4434.5 – but those deep levels only come about if we have a real shift of momentum.
Oil
Outlook for Crude Oil futures for June 9, 2016 – Negative divergence opened the door to sellers, and almost the entire move from yesterday has been retraced this morning. Bullish action remains slightly more probable, but pullbacks may bring us lower highs. Support test long entries hold the least risk, but it should be noted that we are very close to significant resistance.
The trading range on crude oil suggests support action near 49.4, and resistance behavior near 51.58, but could expand into 52.15 on a big bounce (unlikely, but certainly possible).
Upside trades on crude oil futures can be staged on the breach of 51.12, or at a pullback into 50.6. If the chart dips sharply into 50.35 again, buyers will lurk there also. I often use the 30min to 1hr chart for the breach and retest mechanic. Targets from 50.35 are 50.65, 50.92, 51.12, 51.35, 51.58, and if we really expand, 51.71 and 51.95 to 52.15.
Downside trades on crude oil futures can be staged on the failed retest of 50.9, or at the failed retest of 51.25 with negative divergence. Again, we can also look for exhaustion moves north, but with eyes on higher support coming in to push the chart upward. These setups give us targets from 51.25 into 51.12, 50.94, 50.67, 50.46, 50.27, 49.97, 49.72, 49.4, 49.27, 49.04, 49.98, 48.86, 48.7, 48.49, 48.27, 47.97, and perhaps 47.68 to 47.24.
If you’re interested in the live trading room, it is now primarily stock market futures content, though we do track heavily traded stocks and their likely daily trajectories as well – we begin at 9am with a morning report and likely chart movements along with trade setups for the day.
As long as the trader keeps himself aware of support and resistance levels, risk can be very adequately managed to play in either direction as bottom picking remains a behavior pattern that is developing with value buyers and speculative traders.
Twitter: @AnneMarieTrades
The author trades stock market futures every day and may have a position in mentioned securities at the time of publication. Any opinions expressed herein are solely those of the author, and do not in any way represent the views or opinions of any other person or entity.


