S&P 500 Futures Outlook for May 11, 2016 – Stock market futures have held gains nicely thus far. After moving above the initial S&P 500 futures target of 2071.5, we got a retest of this level in the premarket and are now bouncing higher. Keep an eye on this level.
Momentum continues to be key to watch as stock market futures price action tries to hold steady at these support regions and perhaps just a bit lower (between 2064.5 and 2067.75). Charts continue to feel a bit bullish, but focusing on resistance and the breach thereof will be on the list of things to watch for today’s S&P 500 futures outlook.
Formations show, as they did yesterday, that pullbacks into support will hold and press north into resistance (currently near 2078.75 to 2082.5 intraday). The weekly targets upside have been breached, so buyers have primary strength as they hold the breakout levels. Sellers need to prove strength, and so far they are somewhat timid with that.
If S&P 500 futures are able to keep the 2071.5 retest, buyers will be more likely to add steam to the retrace upward back into resistance near 2076.5, and 2078.5, before sellers try to force buyers back down again. If we are unable to rebound above a loss of 2067.25, we’ll see that 2064.5-2068. We are still range bound, but building bullish strength slowly.
Momentum on the four hour chart is bullish but flattening- some choppy action is likely. There seems to be quite a bit of buying power lurking beneath the surface here, and the hold of moving averages hold this power intact. Several lines of sellers are still set to prevent the advance of price upward – 2078.5, 2082.5 and 2088.75. Support levels sit near 2064-2068. Deeper support lies below that at 2061.25.
See today’s economic calendar with a rundown of releases.
THE RANGE OF TUESDAY’S MOTION
Crude Oil Futures (CL_F)
Outlook for crude oil for May 11, 2016 – API reported a 3.5MM barrel build, far more than expected. The EIA report today is expected to show a far smaller build that will likely provide the environment to spike us higher into resistance.
Yesterday the stream on WTI crude oil was very bearish before the open. This gave me the clue to watch for buying action to take hold. Today, we do not see nearly as much bearish chatter (probably because these voices were quieted by the run upward in oil prices), so no clear contra-indicators showing up there, but many expect that the EIA number to positively affect price.
The trading range for crude oil prices suggests support action near 43.9, and resistance behavior near 45.34.
Upside trades can be staged on the positive retest of 44.6, or a bounce off 45.01, but watch for resistance after the breach of 45.01, near 45.34, and 45.63. I often use the 30min to 1hr chart for the breach and retest mechanic. Targets from 44.6 are 44.82, 44.93, 45.01, 45.15, 45.34, 45.63, 45.8, and if we can catch a bid there, we could expand into 46.13 to 46.74.
Downside trades seem feasible below the failed retest of 44.52, or at the failed retest of 44.92 with negative divergence – careful to watch for higher lows at the short on the resistance level. Buyers are sitting all over this chart again this morning, but mixed momentum suggests a choppy motion ahead. Retracement into lower levels from 44.92 give us the targets 44.78, 44.57, 44.34, 44.18, 44.04, 43.93, 43.74, 43.55, 43.37, 43.07, 42.96, and perhaps 42.59, to 42.38, and 41.94.
E-mini S&P 500 Futures (ES_F)
Below is a S&P 500 futures chart with price support and resistance trading levels for today. Click to enlarge.
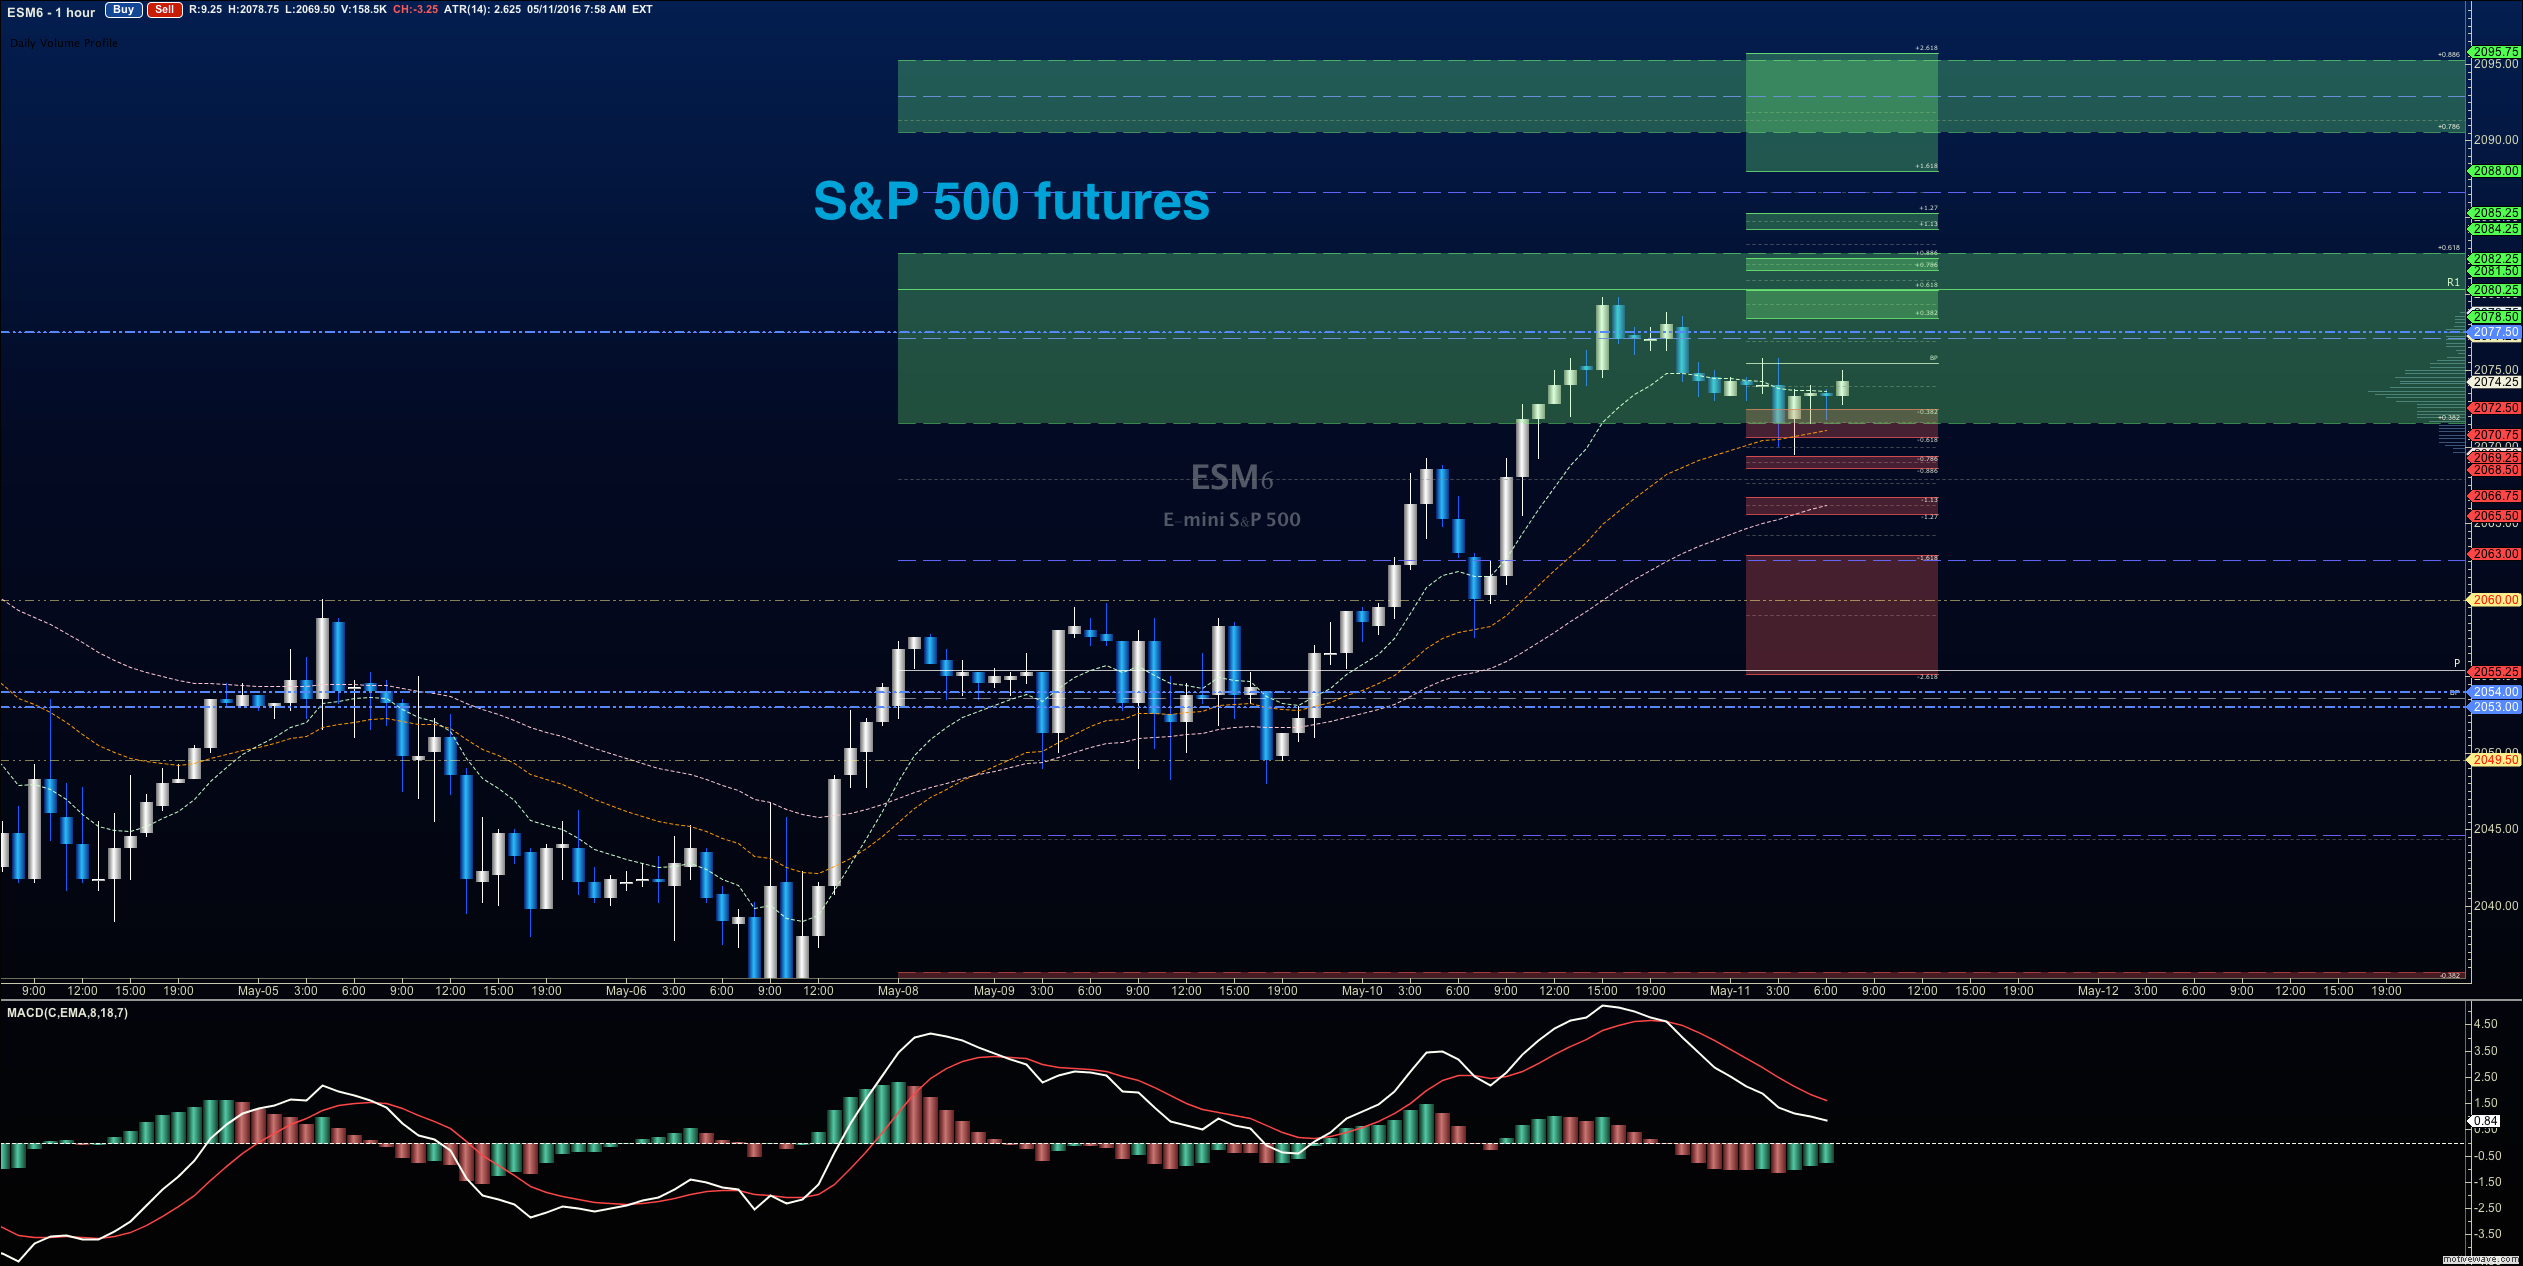
S&P 500 Futures Outlook for May 11, 2016 – Trading appears to be quite range bound, and caught between 2071.5 and 2077.5. I suspect we retest 2077.25 but after that, I am uncertain that we can breach again and hold.
Upside trades will be into resistance, but the best setup sits on the positive retest of 2071.5, or a bounce off 2069.5 with positive momentum. I use the 30min to 1hr chart for the breach and retest mechanic. Targets from 2069.5 are 2071.25, 2073.25, 2075, 2077.25, 2079.5, 2082.25, and if we can catch a bid there, we could expand into 2084.5, 2086.25, and 2088.25.
Downside trades open below the failed retest of 2069.5 or at the failed retest of 2077.25 with negative divergence. Retracement into lower levels from 2077.5 gives us the targets 2074.25, 2071.75, 2069.75, 2067.75, 2064.5, 2061.5, 2059.5, 2057.25, 2054.25, 2051.5, and perhaps 2049.5.
If you’re interested in the live trading room, it is now primarily stock market futures content, though we do track heavily traded stocks and their likely daily trajectories as well – we begin at 9am with a morning report and likely chart movements along with trade setups for the day.
As long as the trader keeps himself aware of support and resistance levels, risk can be very adequately managed to play in either direction as bottom picking remains a behavior pattern that is developing with value buyers and speculative traders.
Twitter: @AnneMarieTrades
The author trades stock market futures every day and may have a position in mentioned securities at the time of publication. Any opinions expressed herein are solely those of the author, and do not in any way represent the views or opinions of any other person or entity.

: Worrisome to Broader Market?")


