Broad Stock Market Futures Outlook for April 2, 2018
For the fifth day, we sit in a range of motion and though the range is a bit wide, it is still a bit of a messy patch that requires we look at support carefully.
Congestion gives us a clue that buyers are sitting at the deep support levels nearby while sellers are not as organized.
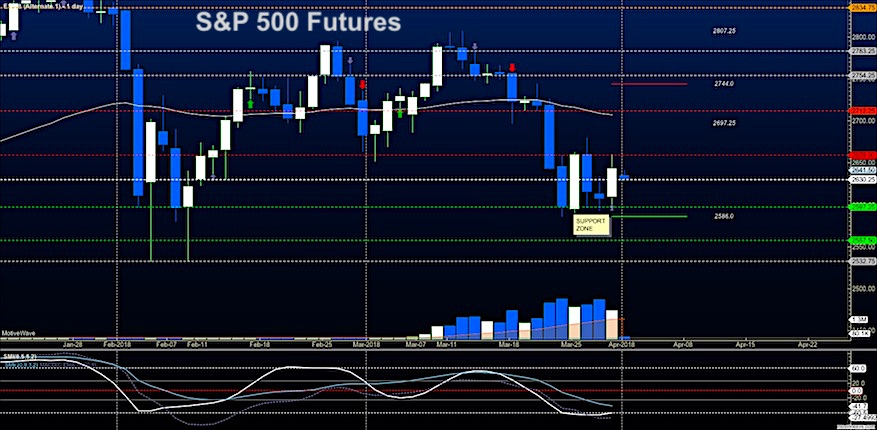
S&P 500 Futures
The challenge of support near 2600 remains for yet another day but higher lows near 2628 could quickly become resistance if we cannot breach and hold above these levels. I suspect this will be the line in the sand between buyers and sellers. The bullets below represent the likely shift of trading momentum at the positive or failed retests at the levels noted.
- Buying pressure intraday will likely strengthen with a bullish retest of 2632.50
- Selling pressure intraday will likely strengthen with a bearish retest of 2609.50
- Resistance sits near 2630.5 to 2636.75, with 2654.25 and 2679.75 above that.
- Support sits between 2621.25 and 2600.75, with 2586.5 and 2558.50
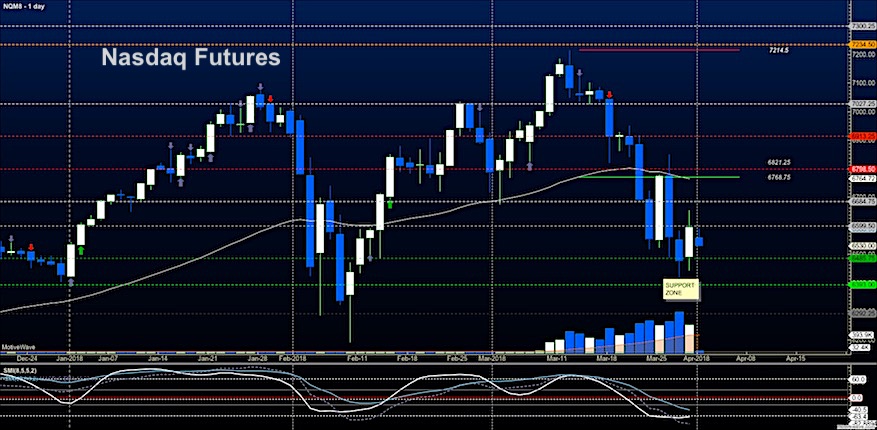
NASDAQ Futures
Messy support sits near 6485 with deep wicks into 6422 and for another day, holding above 6530 will be important in order for buyers to attempt recovery as momentum remains deeply negative. If this chart is bottoming in the short term, we could still see more lows that will be bought up. Risk management becomes increasingly important in these spaces. The bullets below represent the likely shift of intraday trading momentum at the positive or failed tests at the levels noted.
- Buying pressure intraday will likely strengthen with a bullish retest of 6569.5
- Selling pressure intraday will likely strengthen with a bearish retest of 6519.5
- Resistance sits near 6562.5 to 6594.75 with 6648.5 and 6724.5 above that.
- Support sits between 6530.5 and 6519.5, with 6485.25 and 6381.75 below that.
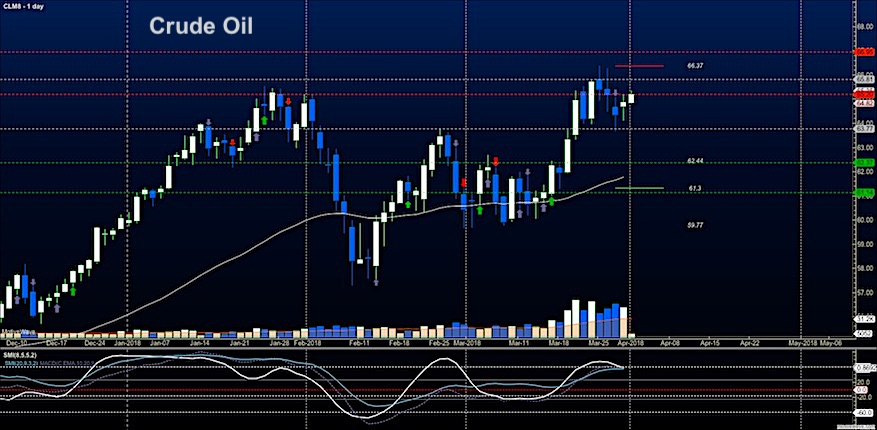
WTI Crude Oil
Price action sits at congested resistance after the bounce last week from the bottom of the range near 63.5. Momentum is flattening from a daily perspective – pullbacks should still be buying zones for the traders. It seems that the level near 65.23 will be the line in the sand that separates the strength between buyers and sellers. The bullets below represent the likely shift of intraday trading momentum at the positive or failed tests at the levels noted.
- Buying pressure intraday will likely strengthen with a bullish retest of 65.38
- Selling pressure intraday will strengthen with a bearish retest of 64.96
- Resistance sits near 65.28 to 65.56, with 65.8 and 66.95 above that.
- Support holds near 64.86 to 64.46, with 63.78 and 63.28 below that.
Twitter: @AnneMarieTrades
The author trades stock market futures every day and may have a position in mentioned securities at the time of publication. Any opinions expressed herein are solely those of the author, and do not in any way represent the views or opinions of any other person or entity.


