THE BIG PICTURE
The major stock market indexes moved higher yet again last week and remain in strong uptrends. The quick pullback that occurred early last week simply teased the bears. And although we remain in an overbought condition and overdue for a pullback, the best thing for traders to do is follow the price action and avoid getting caught up in the noise and anticipating the next move. If/When we enter a market pullback, your process should stop you out of the trade… or offer new looks on both the long & short side.
Here’s my weekly futures trading update and outlook. We’ll start by taking a look at the S&P 500 (NYSEARCA:SPY).
S&P 500 ETF (SPY) Chart – Week 43 (week of October 30)
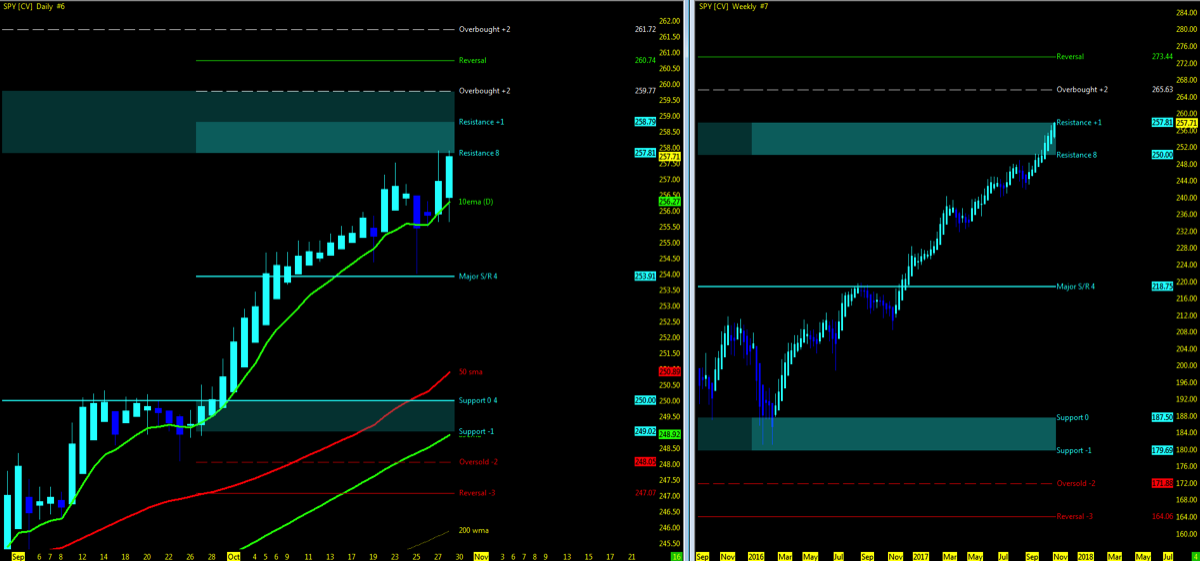
A Note On Using MML Charts: Using the Murray Math Level (MML) charts on higher time frames can be a useful market internal tool as price action moves among fractal levels from hourly to weekly charts. Confluence of levels may be levels of support/resistance or opportunities for a breakout move. Optimal setups will pass through Resistance or Support prior to moving in the opposite trend.
Technical Trends
- Check out my week 43 recap and trend charts
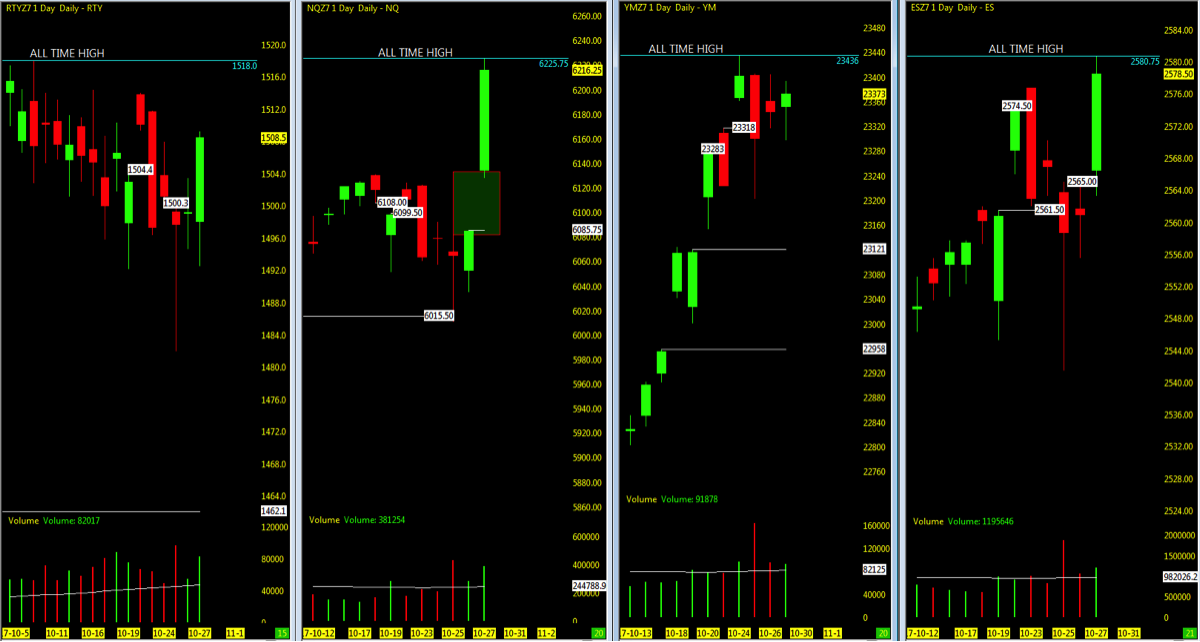
- Nasdaq (INDEXNASDAQ:.IXIC) and S&P 500 (INDEXSP:.INX) showing strong momentum at all time highs
- Newly formed open gap on Nasdaq futures chart
- VIX Volatility Index (INDEXCBOE:VIX) holding around the 10 level
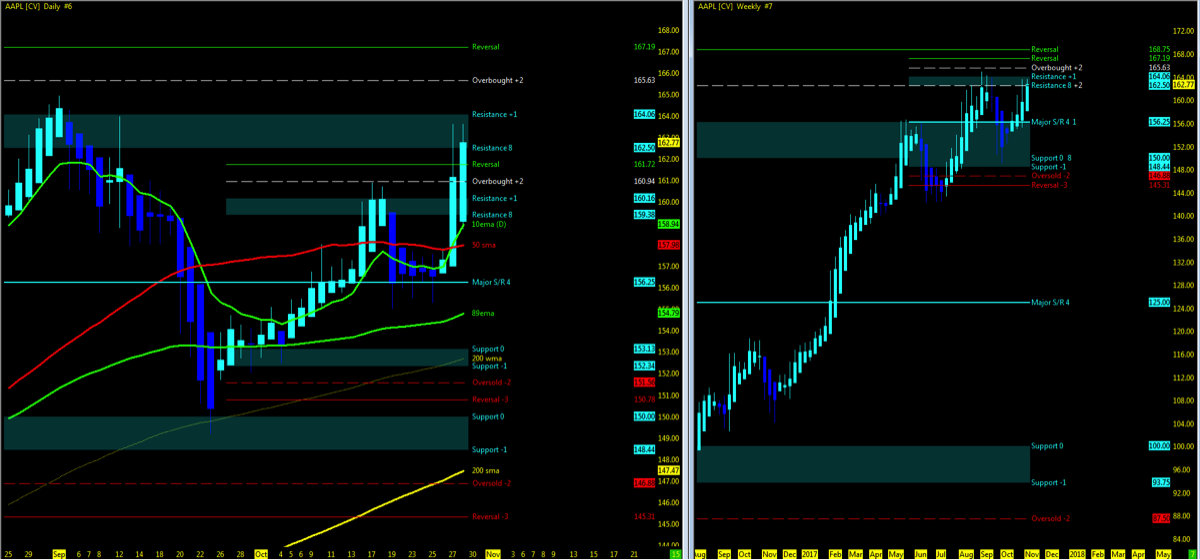
- FANG/FAAMG stocks making all new highs
- Facebook (FB) and Apple (APPL) – charts below – report earnings this week
Key Events in the Market This Week
- USA: FOMC, NFP, End of Month
- GLOBAL: BOJ Monetary Announcement
- Q4 Earnings Season
- AAPL, FB, TSLA, BABA
THE BOTTOM LINE
Technical Momentum probability on the indices remains in an UPTREND.
FOMC/NFP econ numbers will be key to watch this week in market momentum driving higher.
October permabears now back in their caves for now. With earnings season now in full session and NQ market cap leaders reporting positive econ data, momentum remains upside. FB/APPL earnings out this week and if not as expected, a pullback may be in play for the short term. Dollar index (UUP ETF) downside momentum in a pullback and watching for 25 if able to breakout of 24.76, otherwise, line in the sand at short term MML 24.71.
Murray Math levels continue to project higher short term resistance levels as momentum drives higher. Weekly charts at or approaching MML Overbought/Reversal levels with the NQ just approaching resistance Low. Watch for MML setups on price action break above resistance high and back under resistance low for first signs of a pullback. Downside, watch for open gaps to be closed and 50% pullback as 1st level of support.
Stock Market Indices – Lowest Open Gaps
- S&P 500: 1589
- Nasdaq: 3864.75
- Russell 2000: 1462.1
- Dow Industrials: 14745
Attempting to determine which way a market will go on any given day is merely a guess in which some will get it right and some will get it wrong. Being prepared in either direction intraday for the strongest probable trend is by plotting your longer term charts and utilizing an indicator of choice on the lower time frame to identify the setup and remaining in the trade that much longer. Any chart posted here is merely a snapshot of current technical momentum and not indicative of where price may lead forward.
Thanks for reading and remember to always use a stop at/around key technical trend levels.
Twitter: @TradingFibz
The author trades futures intraday and may have a position in the mentioned securities at the time of publication. Any opinions expressed herein are solely those of the author, and do not in any way represent the views or opinions of any other person or entity.


