S&P 500 Futures Trading Chart Image – August 21
MARKET COMMENTARY
S&P 500 Index INDEXSP: .INX traders have kept us near our 2921 region but have not had the pressure to move us higher.
We are in a wait state after recovering from a deeper fade into prior known support near 2892.
This is a cautionary tale that could turn either way so we need to pay attention to ranges today and assume trend holds…until it doesn’t, at which point we move out of the way. Continue to watch your edges.
PRICE ACTION
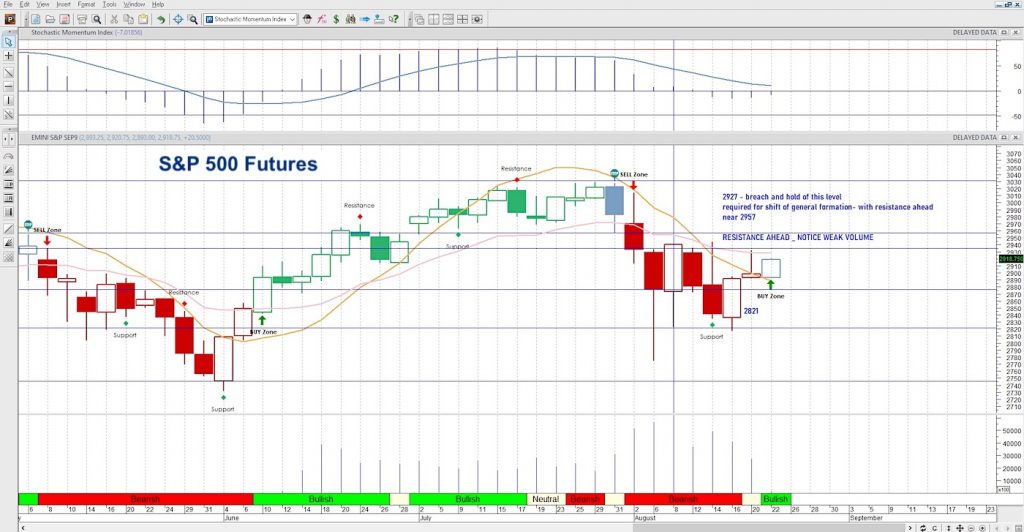
The e-mini S&P 500 moved off support 2892 one more time, and as expected, we bounce into the 2920 region. The fat line in the sand for resistance remains the region between 2937-2941.
If the buyers win this battle, we have another 100 point candle into 3021 that will be formidable resistance at the first pass through. Holding above 2929 will mean the balance of strength has once again swayed to the buyers, for now, but moving above here on light volume implies we don’t have a lot of participation and hence a move downward off these edges.
COMMODITY & CURRENCY WATCH
Gold broke from its high and is now retracing the motion upward yet still holding 1500- key support. Technical divergence we’ve seen in the weeks prior is playing out here so I expect a deeper fade to support but that seems to be moving slowly.
Currency risks are still in play. The USD index now holds above 98 but is beginning to look weak above this level.
WTI Crude is continuing its recovery and is now above 56.3 where buyers are more comfortable. That said – we are looking at major resistance zones and should fade off the highs – EIA report ahead
INTRADAY RECAP
Ranges hold wider and we hold levels between 2892 and 2946- we tested the lower edge yesterday and are now in heavy congestion near 2817. The mini Nasdaq is battling in the range between 7640 to 7750. The mini DOW is holding support near 25864 with resistance sitting near 26248. Continue to be careful here on the edges of your charts as we could accelerate out and continue if traders get too heavy on the edges, in which case, you’ll have to reverse your position. For now, they remain reversal regions.
OVERALL WIDE ANGLE
Deep support bounces engage –shifting the balance of the traders to a bullish stance into resistance. Weekly charts are showing flattening momentum and some more downside weakness that that must be confirmed.
Twitter: @AnneMarieTrades
The author trades stock market futures every day and may have a position in mentioned securities at the time of publication. Any opinions expressed herein are solely those of the author, and do not in any way represent the views or opinions of any other person or entity.
: Creating Bullish Divergence?")

 and Semiconductors (SMH): Concerning Price Pattern?")
 and Semiconductors (SMH): Concerning Price Pattern?")


