Roiling markets around the world are once again disrupting the equity futures market. And China woes have helped to propel S&P 500 futures into deep price support levels, breaking the January lows.
S&P 500 futures now sit just above the 1804.25 low tested in mid January. A big bounce yesterday delivered sellers en masse to force us lower. Now the level to watch is 1823-1827. 1793.5, 1790, and 1780.50 sit below as likely targets but with positive divergence on the daily, I expect these regions to be develop as wicks in our daily candlestick motion (meaning buyers will step in).
Intraday resistance sits near 1825.5. Intraday support sits at 1804. Momentum is negative. We are still hyperextended from moving averages on longer time frames so sharp bounces like yesterday could arise – though as momentum continues negatively with intraday motion showing no signs of lifting, it is likely that we penetrate lows before bouncing.
Shorter time frame momentum indicators are sitting in negative territory and trending down. Longer cycles are downward trending and holding steady in negative territory.
See today’s economic calendar with a rundown of releases.
THE RANGE OF TUESDAY’S MOTION
Crude Oil Futures (CL_F)
The EIA reported the first build in several weeks but that did not keep the bounce alive as oil cascaded. Overnight formations now hold 26.3 as support levels right now but I doubt those hold – crude oil should head lower. But we are sitting in a space where buyers will attempt to bottom pick the chart. So look for the failed bounce on the horizon.
Today, the trading ranges on crude oil futures are between 26.3 and 27.8, with likely moves downward into deeper support levels below. Failure to hold 26.2 region suggests that momentum brings us near the test of 26 and 25.54 – perhaps even 25.25.
Moving averages in oil are back to being negative across all time frames across the board. Hourly time frames show negative sloping moving averages with positive divergence underneath, suggesting the bounce action likely ahead hiding in these prices. BOUNCES SHOULD ONLY BE INTO RESISTANCE AND SHOULD FAIL.
Intraday long trade setup suggests a long off 26.2 retest or 26.9 (with momentum showing positive, else that brings a lower high) into 27.06, 27.34, 27.7, and if we get squeezed here, we’ll see 28.5 on the bounce event.
Intraday short trade setup suggests a short below a 26.2 failed retest or a failed retest of 26.84 with negative divergence showing sends us to 26, 25.81, 25.48, and 25.25. Charts are very negatively biased.
E-mini S&P 500 Futures (ES_F)
Below is a S&P 500 futures chart with price support and resistance trading levels for today. Click to enlarge.
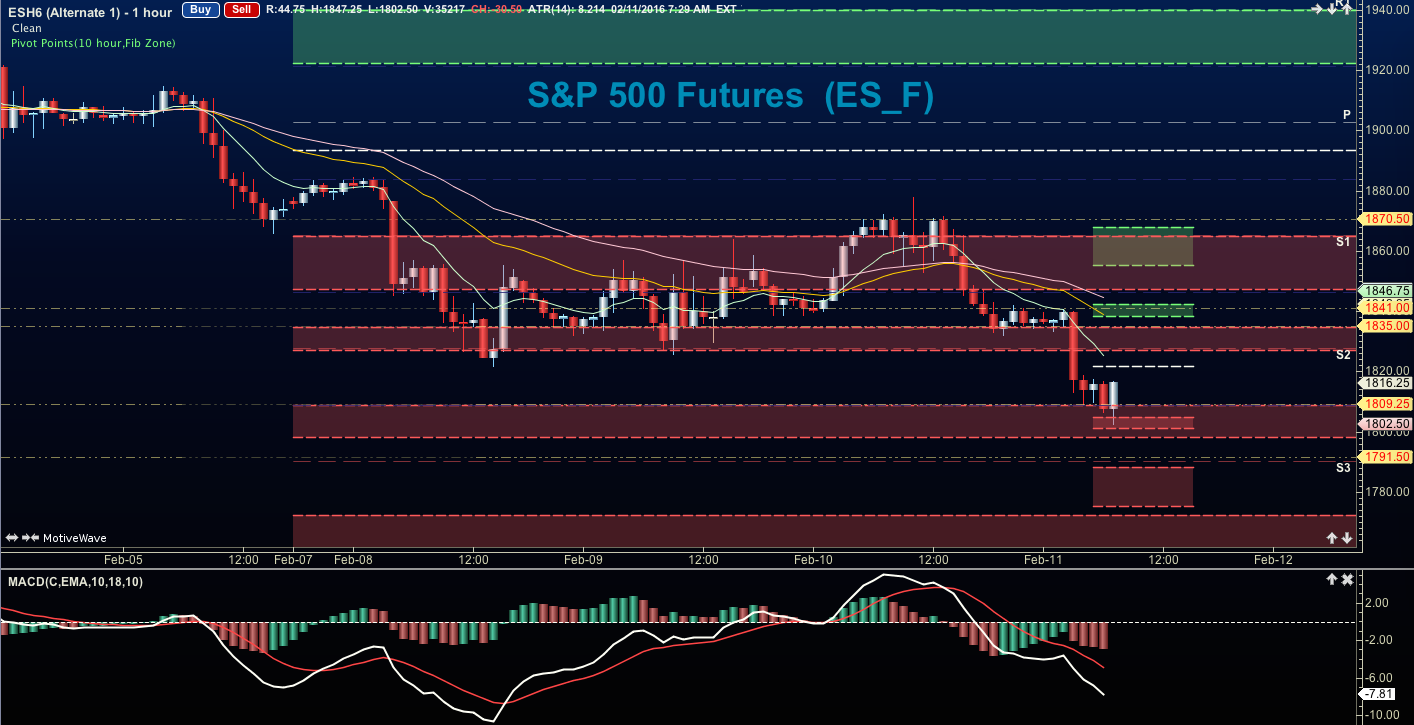
The S&P 500 futures chart is trying to hold early morning congestion regions – 1804-1809 – heavily contested by bottom pickers currently. A region of important support to recapture is 1811.5.
Upside motion on S&P 500 futures has the best setup on the positive retest of 1811.5 – or a retest after expansion above 1815.5. Targets from 1815.5 are 1821, 1826.5, 1831.25, and if we can catch a bid there, we could recapture 1834-1839. Big resistance test sits at the region between 1844-1847. Be careful- watch the higher lows to keep you on the right side of the long trade as this would be extremely countertrend at the moment. S&P 500 futures expansions upside over the longer term could see 1942 to 1960, but that certainly seems extremely unlikely today.
Downside motion for S&P 500 futures opens below the failed retest of 1809 or at the failed retest of 1826.5. Retracement into lower levels from 1826.5 gives us the targets at 1817.5, 1813.5, 1809.5, 1805.5, 1802 and perhaps 1793.75, and 1790.5. 1763, 1752, 1721, and 1614 lie below as longer term potential target zones if buyers do not provide support. We’ll keep our eyes on these expansion zones if the charts fail to bounce.
If you’re interested in the live trading room, it is now primarily stock market futures content, though we do track heavily traded stocks and their likely daily trajectories as well – we begin at 9am with a morning report and likely chart movements along with trade setups for the day.
As long as traders remain aware of support and resistance levels, risk can be very adequately managed to play in either direction as bottom picking remains a behavior pattern that is developing with value buyers and speculative traders.
Twitter: @AnneMarieTrades
The author trades stock market futures every day and may have a position in mentioned securities at the time of publication. Any opinions expressed herein are solely those of the author, and do not in any way represent the views or opinions of any other person or entity.


