S&P 500 Futures Trading Chart – October 18
MARKET COMMENTARY
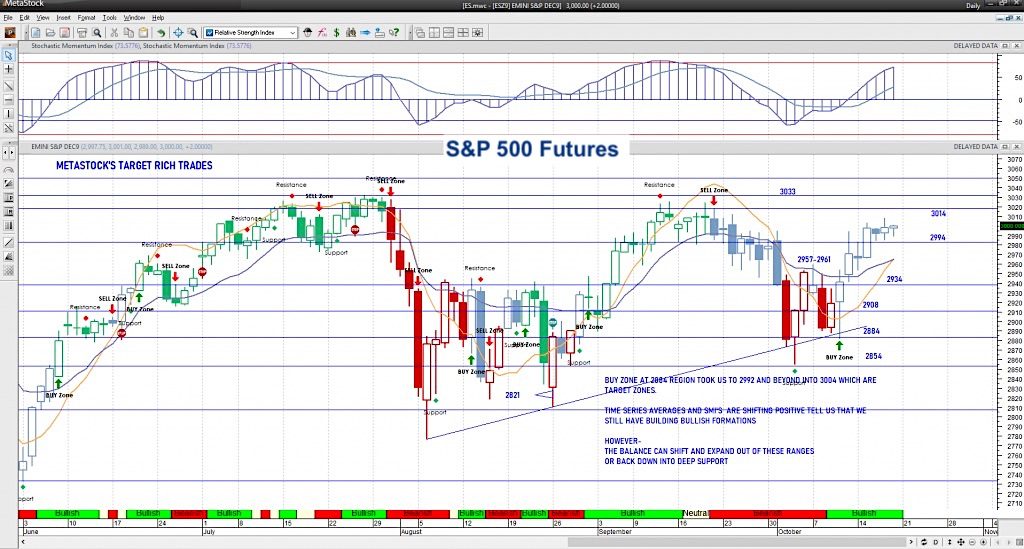
S&P 500 futures are holding at the upper edges of ranges this morning as prices moved in a relatively narrow range on the stock market indices.
Neutral to bullish formations remain but with limited upside short-term.
I would be cautious going long and staying long as we are looking at markets that lift in the morning and fade as the afternoon drags on. The afternoon could be fairly volatile.
WEEKLY PRICE ACTION
Options expire for the monthly options today. Neutral to bullish action with a hold over 2982 for a second day, with reduced to slightly positive momentum present. Indices are at higher edges of the volatility range noted-just shy of break out areas. We closed the week prior near our critical zone of 2972 – and now sit well above it currently- a close over 2994 this week will shift us into more positive trajectories. Pullbacks ought to be buying regions but news algorithms make the ranges wide so use caution jumping in – particularly if we fade through 2982 today.
COMMODITY & CURRENCY WATCH
Gold prices are struggling to recapture 1500 and failing for weeks as we continue in this flag pattern. Use caution with size – there is significant risk in the chart. The US dollar is at a major support region. Breaking down here would likely bring a bounce zone. Another failure and we will lose the channel we have been in for well over a year. WTI sits above 54 in a solid bounce as traders try to build the base here. Traders have been very clear on how important it is to hold this 52-53 levels as support.
TRADING VIEW & ACTION PLAN
Buyers are holding the key break levels above 2994. Be patient and wait for your setups. Mixed undercurrents exist but bullish motion is building within this upper range. Realize that we could bounce higher than anticipated and fade deeper than anticipated before returning to the range. Follow the trend in the shorter time frames and watch the price action.
The theme of motion is NEGATIVE AS LONG AS WE HOLD BELOW 2981ish today (with bounces failing and deep pullbacks holding)-and POSITIVE AS LONG AS WE HOLD ABOVE 2997ish today (with big spikes fading back into congestion) – choppy inside the range. Do what’s working and watch for weakness of trend. Please log in for the definitive levels of engagement today.
METASTOCK SWING SHORT – covered at 2990 for net gains of 14 points. Notice if the support edge is 2982 and traders could not take us below 2982, we could see more bounces on the horizon. The pattern is showing as bullish that is losing strength-
METASTOCK SWING LONG PROSPECTS – I am looking for a pullback into our support levels noted in our blog levels to engage. These are all short term longs.
Learn more about my services over at The Trading Book site.
Twitter: @AnneMarieTrades
The author trades stock market futures every day and may have a position in mentioned securities at the time of publication. Any opinions expressed herein are solely those of the author, and do not in any way represent the views or opinions of any other person or entity.

: Worrisome to Broader Market?")
