For the past several days, I have been talking about the range we’ve been in. During the past few weeks, the S&P 500 futures developed a floor around 2070.
Any buyers swooped in each time S&P 500 futures declined into (or near) that level.
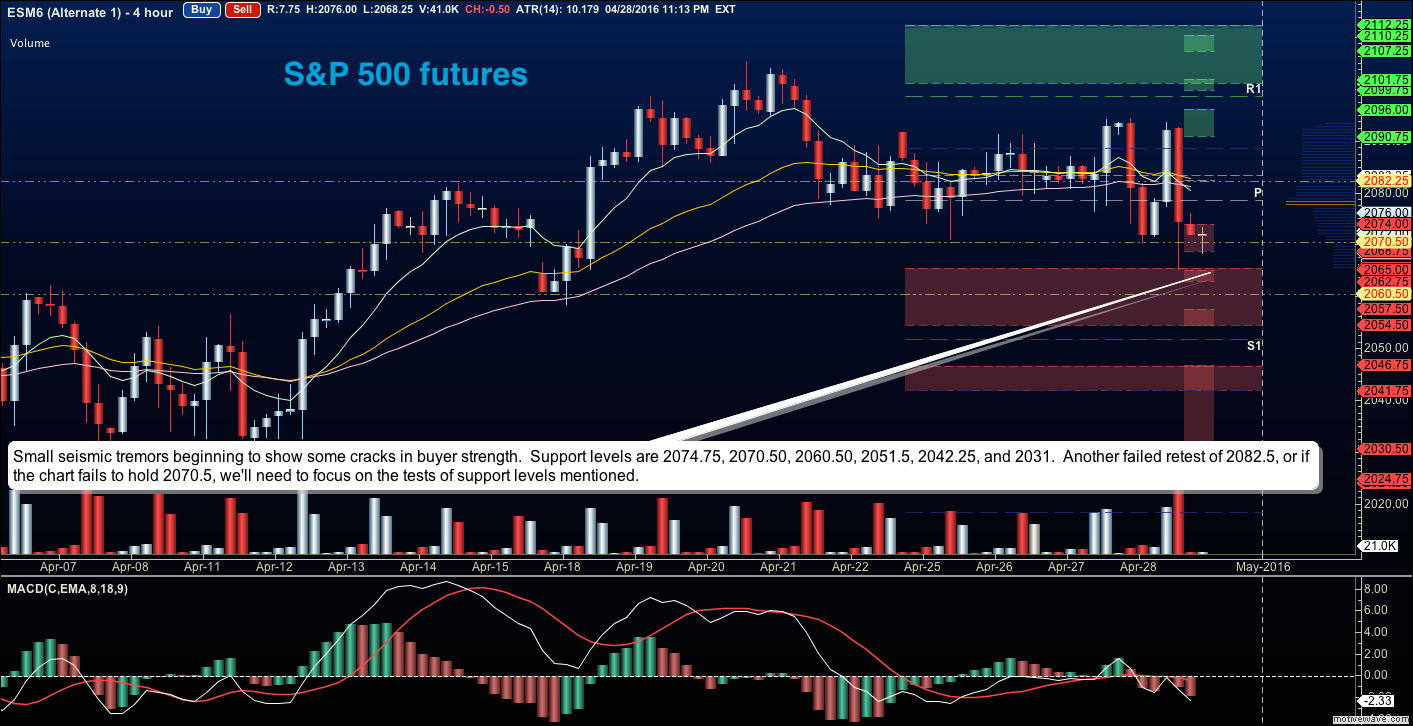
But yesterday, the futures index broke that level briefly. Perhaps a warning. The chart below highlights the importance of this level.
Small seismic tremors are starting to show cracks in buyers strength. Another failed retest at 2082.5 makes S&P 500 futures vulnerable. 2070.5 is the key level of support, but as I type that level is being broken. This puts 2060.50 into view, followed by 2051.5, 2042.25, and 2031. Trade safe.
Thanks for reading.
Twitter: @AnneMarieTrades
The author trades stock market futures every day and may have a position in mentioned securities at the time of publication. Any opinions expressed herein are solely those of the author, and do not in any way represent the views or opinions of any other person or entity.
: Creating Bullish Divergence?")

 and Semiconductors (SMH): Concerning Price Pattern?")
 and Semiconductors (SMH): Concerning Price Pattern?")


