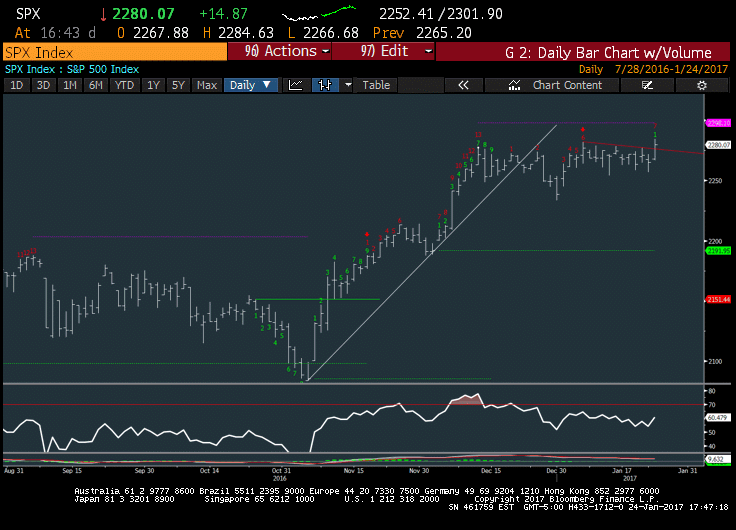
S&P 500 Futures Outlook (2-3 Days) – Bullish
Breakout to new all-time highs on the S&P 500 (INDEXSP:.INX) and NASDAQ Composite (INDEXNASDAQ:.IXIC) should help prices accelerate up to near 2300. This constitutes a breakout of the entire range since mid-December, and is a short-term positive. Buy pullbacks at 2271-2, and 2262-4 maximum for a move up to 2292, then 2298-2300.
Broader Market Technical Thoughts
Tuesday’s breakout looks meaningful. Prices rose to new intra-day and closing highs on daily charts for the S&P 500 along with the Nasdaq 100 (NDX) and NASDAQ Composite while breadth finished at near 3/1 positive. This helps to clear the entire base which had been intact since mid-December. This should result in the one-month trend going from neutral to bullish as prices start to emerge back to new highs territory.
Near-term resistance lies near 2300 and may contain gains into early February. BUT unless this reverses quickly (and sees technical damage), this should be seen as a positive move and may allow for additional upside into February. Next month is typically seen as a seasonally bearish month in post-Election years, and given the degree of this run-up we may see a pause and/or reversal. For now, its best to obey near-term price action and stick with this move, while looking to buy any minor dips if given the chance.
Specifically, Materials (XLB) and Financials (XLF) both turned up fairly sharply in trading on Tuesday with XLB moving back to new all-time highs. Five groups were higher by more than 1%, and the fact that the Financials joined Technology and Industrials in making this move is seen as a definite positive. Additionally, Small-caps joined the fray with IWM moving to new multi-day highs, while Transports also leapt to new weekly highs with IYT getting back to the highest daily closing level since 12/20. Bottom line, the sideways grind that we’d seen for over a month now looks to be giving way to a more broad-based move higher, and adds conviction to the near-term bullish case.
Treasury yields meanwhile leapt back up and retraced most of the prior days’ pullback, as US Treasury yields along with German Bunds and UK Gilt yields have begun to show more serious signs of moving higher. This should be a positive development for Financials, and while US Financials gained ground Tuesday, we also saw European Banks arguably break out of a triangle pattern which had been intact since mid-December. This bodes well for Financials to outperform in the short run, while yield sensitive sectors like Utilities, Telecomm, and REITS likely face headwinds.
S&P 500 Index
Tuesday’s gains finally brought some excitement back to the market, for those that prefer a bit of volatility (as opposed to EKG like charts). The S&P 500 (SPX) managed to exceed the highs of the range for the first time since highs were made for many US, European, and Asian indices between December 9-13th.
This is definitely a near-term positive development for SPX with number of 20-day highs jumping to new monthly highs in both SPX and NDX. Additional gains look likely up to 2300, which should serve as resistance into end of month, and lies just 20 S&P points away entering today. For now, Tuesday’s gains look difficult to fight, and minor pullbacks should serve as buying opportunities in days ahead.
Thanks for reading.
Twitter: @MarkNewtonCMT
Any opinions expressed herein are solely those of the author, and do not in any way represent the views or opinions of any other person or entity.


