Is the broader stock market pullback over? Or is this the start of a deeper pullback / correction?
Although I believe the index was overdue for some back and filling, this question remains to be seen.
We can, however, take a look at Fibonacci retracements to highlight levels where traders and big money may be eyeing.
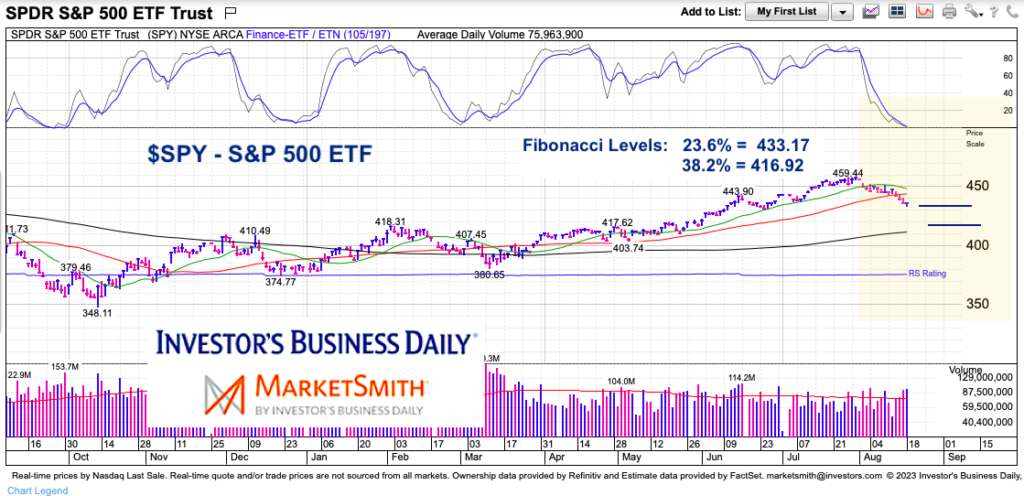
Today, we look at a chart of the S&P 500 ETF (SPY) to highlight the 23.6 and 38.2 Fibonacci retracement levels. Pretty simple exercise but Fibs are heavily used across the trading universe and provide guideposts.
Note that the following MarketSmith charts are built with Investors Business Daily’s product suite.
I am an Investors Business Daily (IBD) partner and promote the use of their products. The entire platform offers a good mix of tools, education, and technical and fundamental data.
$SPY S&P 500 ETF “daily” Chart with Fibonacci levels
As you can see, we are near the 23.6% Fibonacci level. If that breaks, look for the 38.2% level to be tested.
Twitter: @andrewnyquist
The author may have a position in mentioned securities at the time of publication. Any opinions expressed herein are solely those of the author, and do not in any way represent the views or opinions of any other person or entity.
8/25/23 2:30pm Editor shared updated fibonacci levels image.


 Testing Important Price Support")


