The market bounce is over and traders are now watching to see if the recent lows hold.
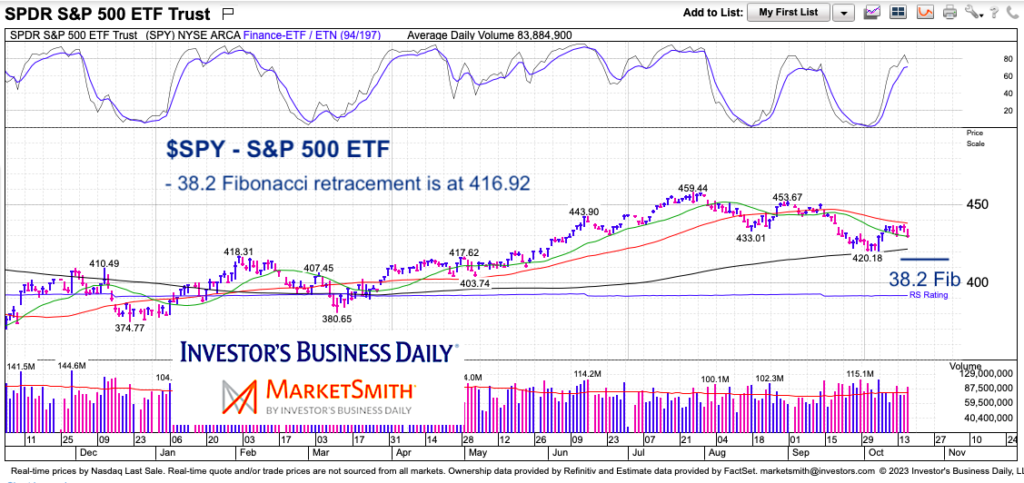
It is worth noting that the recent lows came close to the 38.2 Fibonacci retracement target, but did NOT hit it. Will close be good enough?
I wrote about the Fibonacci pullback targets back in August, and again in September. So why not refresh them once again in October.
Will be interesting to see if the current two day selling evolves into something further. And, if so, will we finally tag that 38.2 Fibonacci support? Or perhaps even see more selling to the 50 or 61.8 support targets.
Note that the following MarketSmith charts are built with Investors Business Daily’s product suite.
I am an Investors Business Daily (IBD) partner and promote the use of their products. The entire platform offers a good mix of tools, education, and technical and fundamental data.
$SPY S&P 500 ETF Price Chart with key Fibonacci Target
Twitter: @andrewnyquist
The author may have a position in mentioned securities at the time of publication. Any opinions expressed herein are solely those of the author, and do not in any way represent the views or opinions of any other person or entity.


