The stock market bounce is losing steam and appears to be rolling over.
If this is the case, then active investors should be aware of where the stock market may be headed.
Today, I’m going to provide an update on S&P 500 ETF (SPY) pullback levels, including the Fibonacci retracement levels that I highlighted a few weeks ago.
The pattern to watch today is the A-B-C pullback…
Note that the following MarketSmith charts are built with Investors Business Daily’s product suite.
I am an Investors Business Daily (IBD) partner and promote the use of their products. The entire platform offers a good mix of tools, education, and technical and fundamental data.
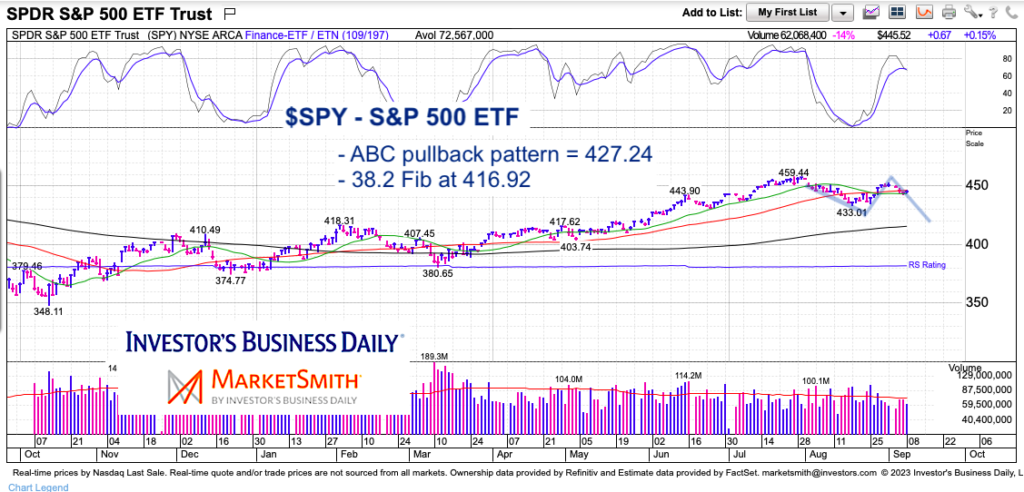
$SPY S&P 500 ETF “daily” Chart
As usual, I let my chart speak for itself and keep things as tidy as possible. As mentioned a few weeks ago, the 38.2 Fibonacci retracement price target (of the entire bounce from last year’s low) is at 416.92 – this is quite possible should we see this rolling over process complete. The 38.2 Fib area also aligns with the 200-day moving average.
I’m also eyeing the potential for an A-B-C pattern. This pattern can come with equal legs, which would target $427.24, but sometimes the C penetrates a bit deeper.
I’ll use these as guideposts for a potential trading long between 416-430 (I always buy in fractions, usually 1/3, 1/3, 1/3). Maybe buyers come back and this trade is off the board… but I’ll be ready.
Twitter: @andrewnyquist
The author may have a position in mentioned securities at the time of publication. Any opinions expressed herein are solely those of the author, and do not in any way represent the views or opinions of any other person or entity.


