While adhering to our unique methodology, we remain cognizant of other types of technical analysis. One of these is Elliott Wave Analysis.
Today we’ll update readers on our long-term S&P 500 (INDEXSP:.INX) Elliott wave count. You can read our prior update here. First some background…
In the 1930’s, Ralph Nelson Elliott recognized that stock market prices trend and reverse in recognizable patterns. The patterns are repetitive in form, but not necessarily in time or amplitude. He named, defined, and illustrated the patterns. Elliott also noted that the patterns are fractal in nature. In other words, they link together to form larger versions of themselves. Thereby, they produce a structured progression.
Fractals can be found throughout nature. Elliott called his form of analysis the Wave Principle. The Wave Principle is not primarily a forecasting tool; it is a detailed description of how markets behave.
Elliott’s structured progression takes the form of five waves. Three of these waves (labeled 1, 3, and 5) effect the directional movement. These waves are separated by two countertrend interruptions (labeled 2 and 4). This five-wave structure is referred to as a “motive” wave, because it powerfully impels the market in the direction of the primary trend.
Following a motive wave, markets typically correct in the opposite direction in a threewave structure. This three-wave structure (labeled a, b, and c) is referred to as a “corrective” wave. Corrective waves appear as a response to the preceding motive wave, yet accomplish only a partial retracement of the progress achieved. Therefore, a complete cycle consists of eight waves. A textbook example of a completed 8 wave cycle is shown below. To learn more, we suggest reading Elliott Wave Principle by A.J. Frost and Robert R. Prechter Jr.
When applying the Wave Principle, it is recommended that one starts at the point in time when the security began trading. Accordingly, we think it is appropriate to begin analysis of the cash S&P 500 Index in March 1957, the date when the index first included 500 stocks. Our analysis of the cash S&P 500 Index can be seen in the chart below. Each candlestick represents one year. The y-axis is on a natural log scale. Additionally, the chart is annotated with the salient points related to the Wave Principle.
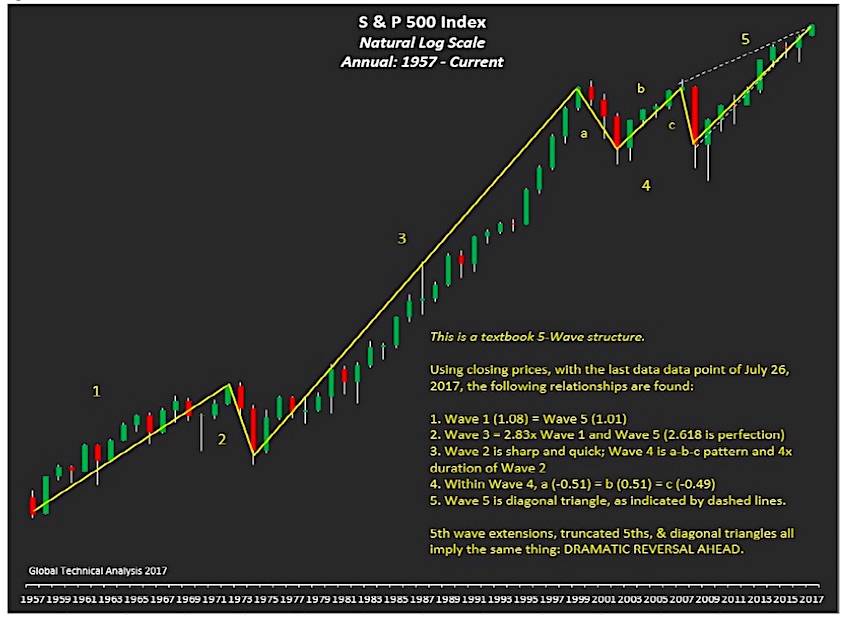
The Wave Principle suggests that the S&P 500 Index is completing a 60-year, five-wave motive structure. If this analysis is correct, it also suggests that a multi-year, three-wave corrective structure is immediately ahead. We do not make explicit price forecasts, but the Wave Principle proposes to us that, at a minimum, the lows of 2009 will be surpassed as the corrective structure completes.
Updated Elliott Wave Analysis Commentary
Astute readers noted that in Figure 1, Wave 1 (1.08) did not exactly equal Wave 5 (1.01). The first question we received after sharing the analysis was “At what price are they equal?” The price level at which they are equal is 2660. Market participants of old, whose collective framework of market analysis we admire, stated to “always allow for the fog of markets”. More succinctly, they allowed a +/- 2% margin of error in time and price for long-range forecasts. Applying that rule of thumb to our price analysis, we anticipate Wave 5, the ending wave of a 60-year pattern, will complete within the range of 2607 to 2713.
Another question we recently received was “What happens to the analysis if the market exceeds the upper end of the 2607 to 2713 range?” In that scenario, we will identify the Fibonacci harmonic (1.382, 1.618, etc.) levels of Wave 1 to isolate further resistance. While our conviction level is extremely high that the market is in Wave 5, trying to objectively isolate where its ascent ends is of vital importance, for we believe it will be unsurpassed for many years.
Using our standard methodology, monthly resistance for December is clustered at 2723/2736 (slightly higher than the upper-end of the range identified by Elliott Wave). The upside exhaustion level for December is 2800. Market participants can address adjusting risk on a sustained ascent above 2736.
Check out more of my research over at Global Technical Analysis. Thanks for reading.
Twitter: @Techs_Global
Any opinions expressed herein are solely those of the author, and do not in any way represent the views or opinions of any other person or entity. The author doesn’t not have a position in the mentioned securities at the time of publication.


 Flirting With Critical Support… Again")

