Looking at the S&P 500 (SPX) through the lenses of DeMark indicators and S&P 500 DeMark levels, the next several weeks could be very telling.
First things first, let’s discuss the current price action on the weekly chart of the S&P 500 and review the current S&P 500 DeMark counts.
There is almost no chance that the active weekly “TD Buy Setup” will cancel before printing the final Bar 9 since that would require a Friday close on the S&P 500 above 2060. If it does not cancel, it would be only the second time since the March ’09 bottom that a “TD Buy Setup” completes.
Contrary to what the name of the indicator may suggest, a Buy Setup is not a bullish occurrence: the fact that 9 consecutive bars satisfy the requirements of the indicator establishes that the sellers have enough power to drive a downward trend. Perhaps the indicator gets its name because, following its completion, there’s an expectation of a short-term counter move in the opposite direction, i.e. the expectation of a tradable bounce.
There are several other considerations that can make a completed S&P 500 DeMark buy setup more or less of a bearish tell. First and foremost is whether the setup completes above or below the TDST Level Down line. Regardless of the time frame one chooses to use, the TDST Levels (Down or Up) reflect the support/resistance areas which, if violated on a “qualified” basis, would suggest that the trend that had been in place until that point has changed.
As you can see from the chart below, the last time a weekly TD Buy Setup printed (back in 2012) it did so comfortably above the then active TDST Level Down. The price action ended up turning around, it completed a TD Sell Setup (9 bars trending up, showing good buying energy), and when the TDST Level Up line was broken on a “qualified” basis, it was off to the races.
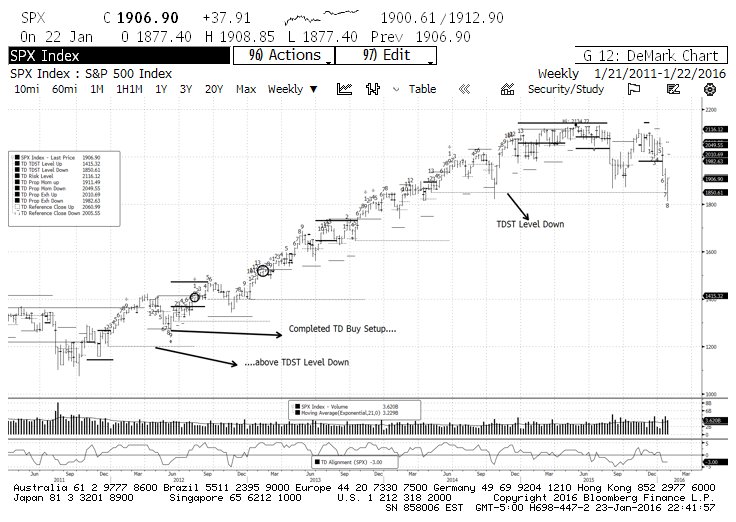
Fast forward to now, and the applicable TDST Level Down sits at 1850.61. I have used the term “qualified” (vs. “non-qualified”) a couple of times to describe the nature of a Level break. I won’t get in the weeds of what it takes to “qualify” a break of a TDST level, but the difference between the two may be summed up as follows: a “non-qualified” break can be viewed as a false breakdown/breakout; a “qualified” break is much more likely to be the real thing. In short, a close on Friday below the TDST level followed by a lower open and a lower lows on Monday would qualify the price break. (Note: the conditions I laid out will not necessarily apply to the upcoming weeks as there are other considerations in play). You can learn more about DeMark analysis in the book “DeMark Indicators” by Jason Perl (or by reading up on the service).
Either way, stock market bulls DO NOT want to see that. A change to a bearish trend on a weekly timeframe can fairly be paraphrased as the beginning of a cyclical bear market.
If the TDST Level Down break fails to qualify, or, even better, there is no close below 1850.61, bears will need to weigh whether they want to stick around for more, or whether to declare victory and go home. Conversely, bulls will be able to exhale for the time being and see if they can regroup and resume the upward march of the current bull market.
Either way, for bullish and bearish followers of DeMark analysis, this coming week (and probably several more thereafter) are shaping up to be as important a stretch as the market has offered in the last 7 years.
Good luck and good trading!
Twitter: @FZucchi
Author does not have a position in the mentioned securities at the time of publication. Any opinions expressed herein are solely those of the author, and do not in any way represent the views or opinions of any other person or entity.


