S&P 500 Index Chart Analysis INDEXSP: .INX
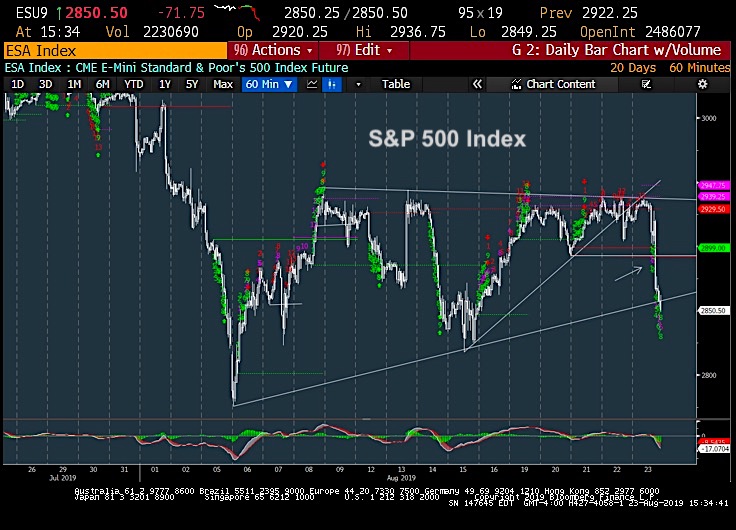
The S&P 500’s break of 2892 is considered bearish structurally.
The index temporarily stabilized near prior lows, but we could see additional near-term weakness down to 2817 on S&P 500 Futures before any type of trading low.
Overall, this could lead to acceleration to challenge early August and/or June lows.
A move below 2817 will open the door for 2779.
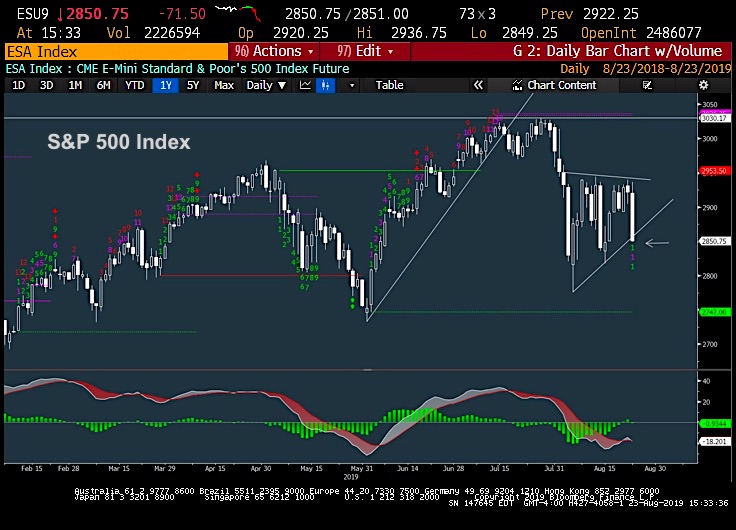
The S&P 500’s decline is threatening to violate the trend from early August, something that would very likely bring about weakness into end of month, vs a rally.
Market breadth has changed to nearly 5/1 negative and has worsened throughout the session. Volume also is at similar levels.
Overall, Friday is looked upon as a negative structurally and Treasury yields are also declining nearly 10 bps with TNX back down under 1.52%. Overall, it’s right to be defensive and to seek out the areas of strength.
If you have an interest in seeing timely intra-day market updates on my private twitter feed, please follow @NewtonAdvisors. Also, feel free to send me an email at info@newtonadvisor.com regarding how my Technical work can add alpha to your portfolio management process.
Twitter: @MarkNewtonCMT
Author has positions in mentioned securities at the time of publication. Any opinions expressed herein are solely those of the author, and do not in any way represent the views or opinions of any other person or entity.

: Worrisome to Broader Market?")


