Well, investors finally received a pullback across the broader stock market indices. It’s still too early to tell how deep the decline will run, but for now the indices are pausing/holding near key short-term support.
The S&P 500 Index (INDEXSP:.INX) is trading around 3 percent off its highs but some headwinds remain… and could call prices a lower. Stocks are battling some underlying weakness and heavy momentum.
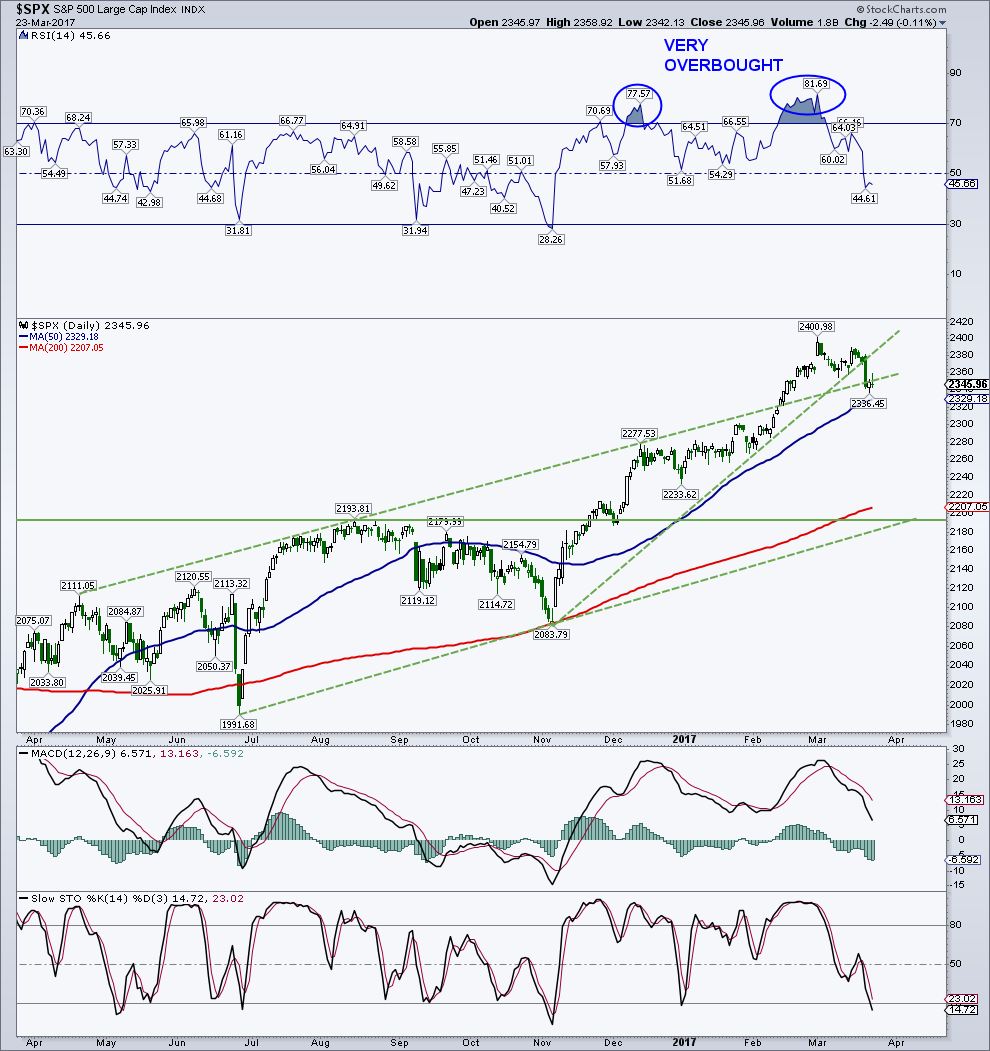
Looking at the chart below, we can see that the “500” is trying to hold the 2340 area. The next support resides at the 50-day moving average (2,329). I would prefer to see a retest of “ledge” support down in the 2,300 area. From a trading standpoint, I will start to increase equity allocation at 50-day (a little), then some more at the 2,280/2,300 area. Should the S&P 500 fall below 2,280, it would likely visit the 2,234 are (another good place to add).
My worst case for now is a full blown retest of 2,200 area or the real breakout level and the 200-day moving average.
S&P 500 Chart w/ technical support levels
Thanks for reading and good luck out there. Feel free to reach out to me at arbetermark@gmail.com for inquiries about my newsletter “On The Mark”.
Twitter: @MarkArbeter
Any opinions expressed herein are solely those of the author, and do not in any way represent the views or opinions of any other person or entity.

: Showing Some Signs of Emerging Strength")
