The S&P 500 has seen a fair amount of bearish days of late.
And although the damage isn’t extensive, today’s reversal lower caught my attention.
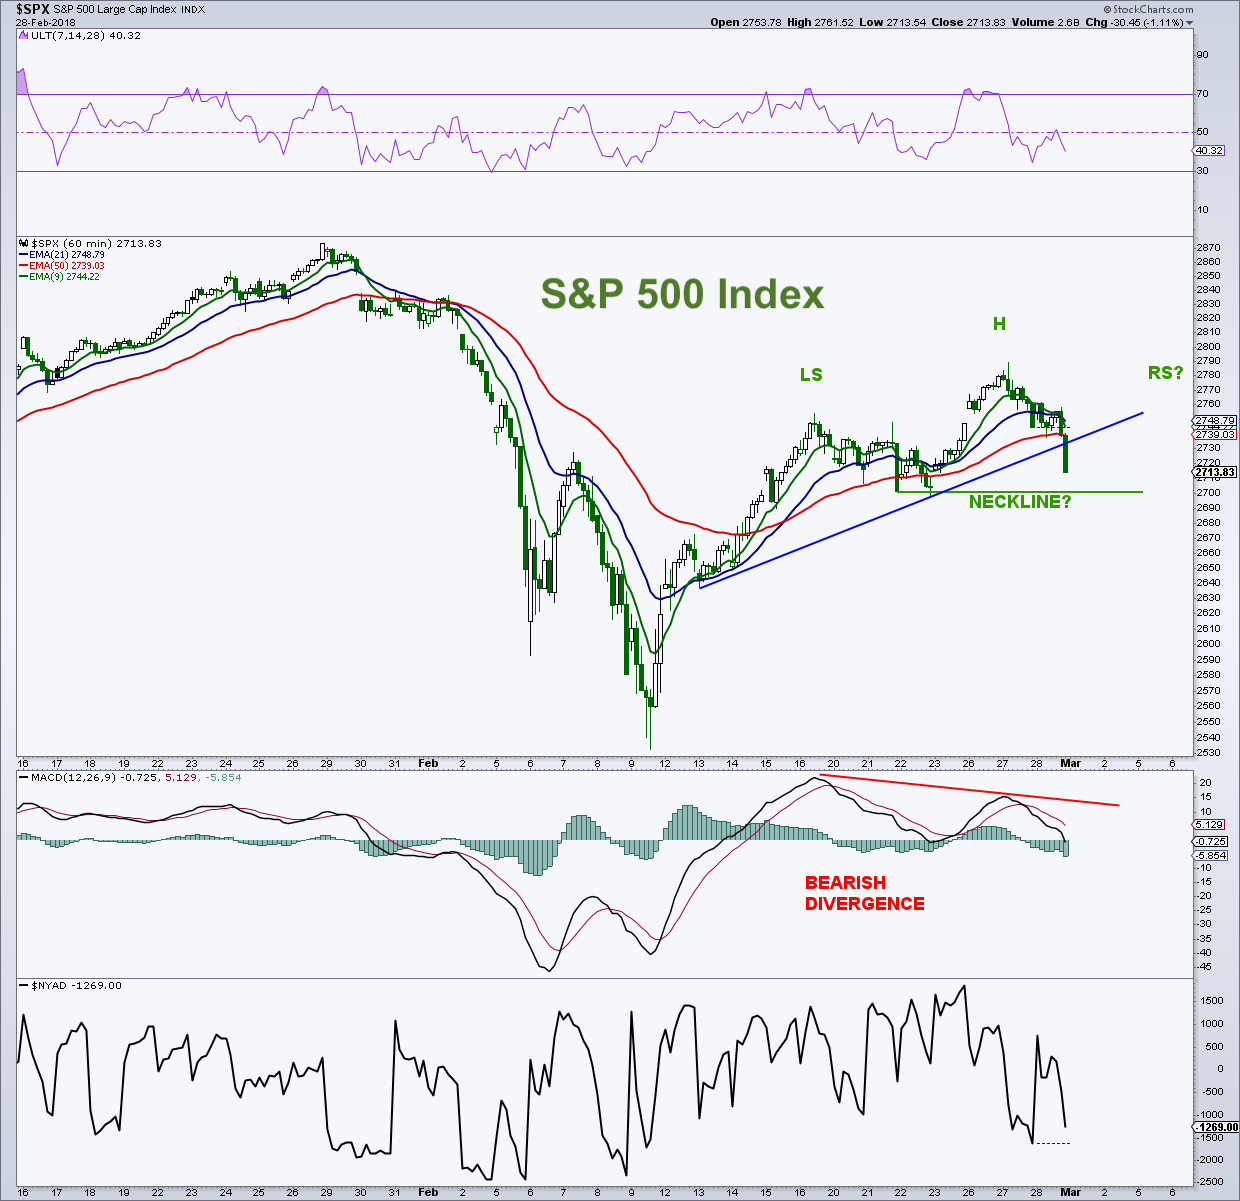
S&P 500 Chart – Bearish Pattern Or Healthy Consolidation?
Back to back heavy red bars are setting up for a test of 2700.
It is possible that the S&P 500 is tracing out a bearish head-and-shoulders top on the 1 hour chart. It is too early to complete the pattern as we still need a move down toward the neckline and then see another rally that fails to form the right shoulder. If this does complete, we could see a measured move down toward the 2,620 area.
However, until we break that neckline, it is nothing more than some sideways consolidation within the confines of the recovery.
Feel free to reach out to me at arbetermark@gmail.com for inquiries about my newsletter “On The Mark”. Thanks for reading.
Twitter: @MarkArbeter
The author does not have a position in mentioned securities at the time of publication. Any opinions expressed herein are solely those of the author, and do not in any way represent the views or opinions of any other person or entity.


