BIG PICTURE – What’s Ahead?
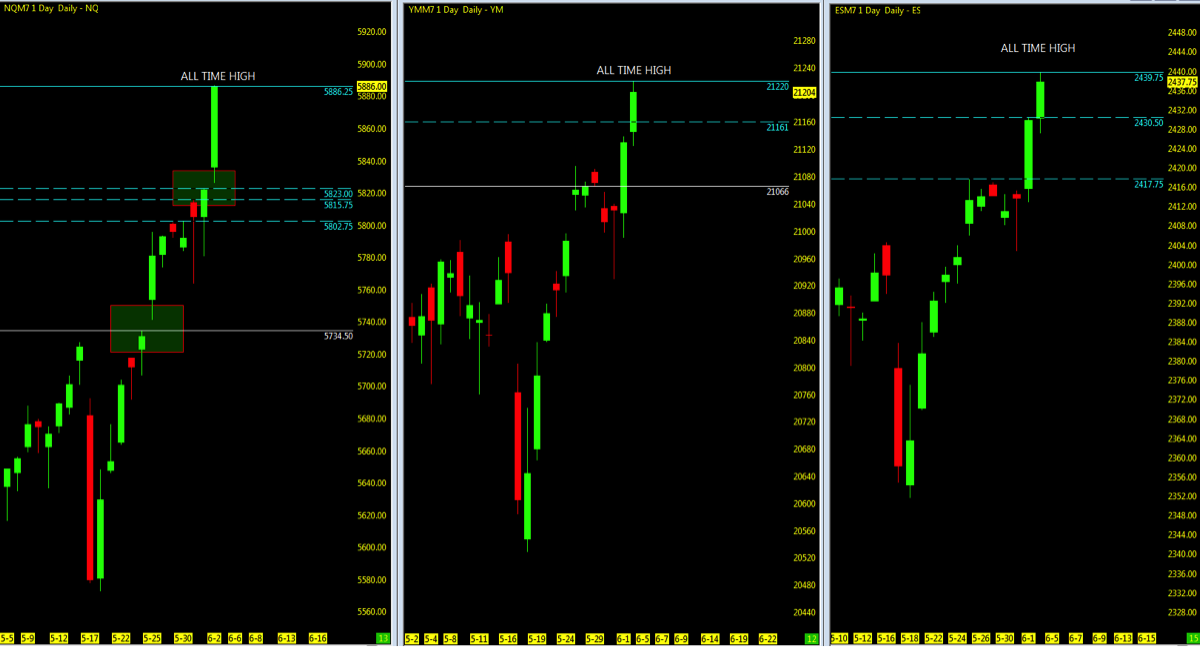
Recapping last week, the market indices held and closed above the weekly open (full recap which may be found here) with the several key indices including the S&P 500 (INDEXSP:.INX) and Nasdaq (INDEXNASDAQ:.IXIC) achieving new all time highs in week 22.
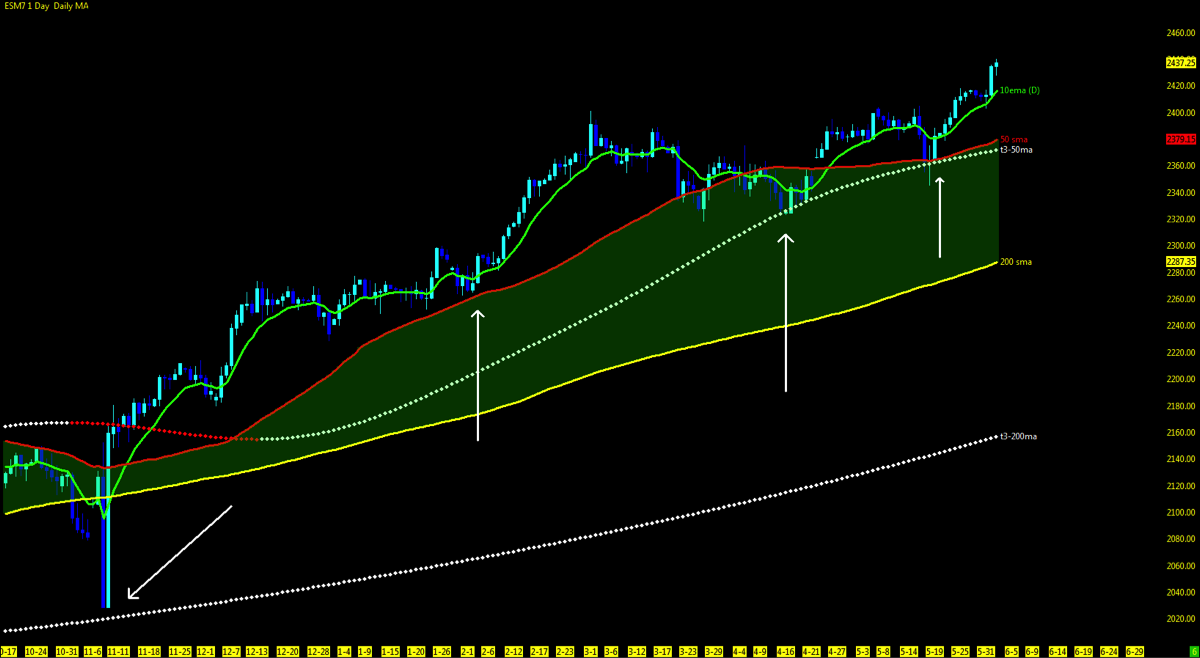
The beat goes on… and the market maintains its unprecedented and somewhat bewildering relentless uptrend. Each index holds above the short term 10 and mid-term 50 period moving averages.
VIX levels once again are hovering around historic lows under 9 as the market has been quite complacent with the status quo. No question as to a matter if but when the dips are being bought on an intraday basis. Volume not being an issue as price action has maintained its course upside. FANG stocks hitting all time highs as Amazon (NASDAQ:AMZN) crosses the $1000 finish line and holds above to close out week 22. “Sell in May and Go away” did not play out well for the permabear and with two days into June, it doesn’t seem to be letting up anytime soon. Then again, rate hikes and world unbalance in Venezuela and Brazil to start, can throw the markets into a tizzy in the doldrums of summer trading.
Playing caution into last week, where I wanted to see a follow through with price and volume was a match met. Open Gaps were closed on the ES and YM and only the NQ to form a new gap.
With no upper levels at all time highs to refer to and retest, technical upper levels are left to the projections of studies that forecast out percentages. Be it Fibonacci projections, daily upper resistance levels or Murray Math Levels to name a few that can be levels to watch upside.
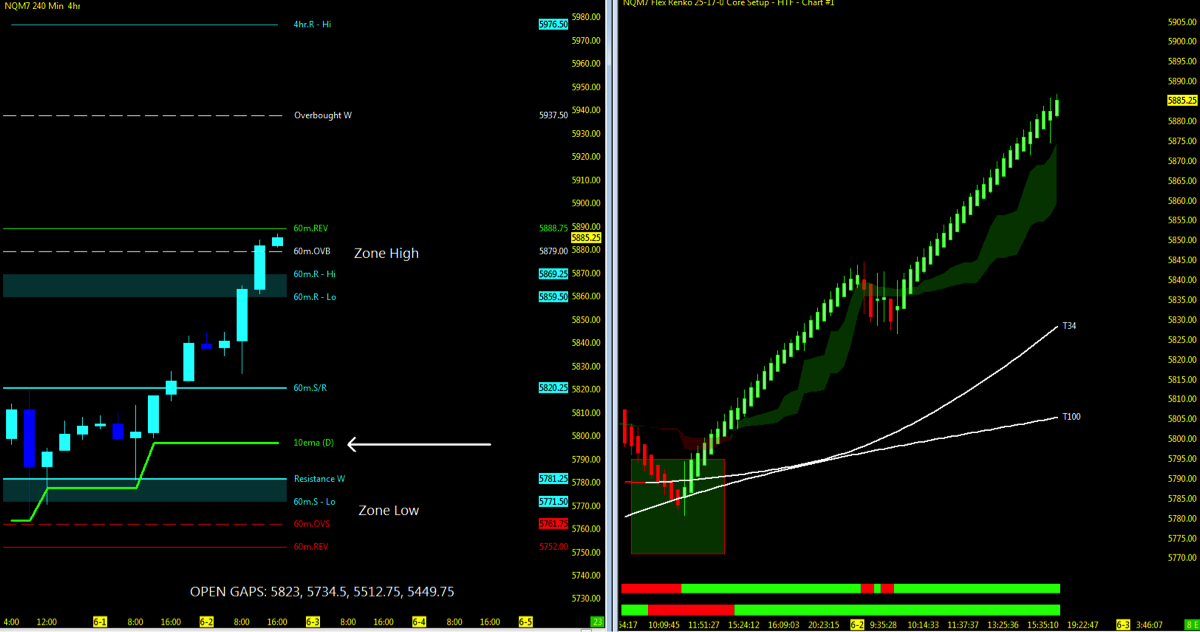
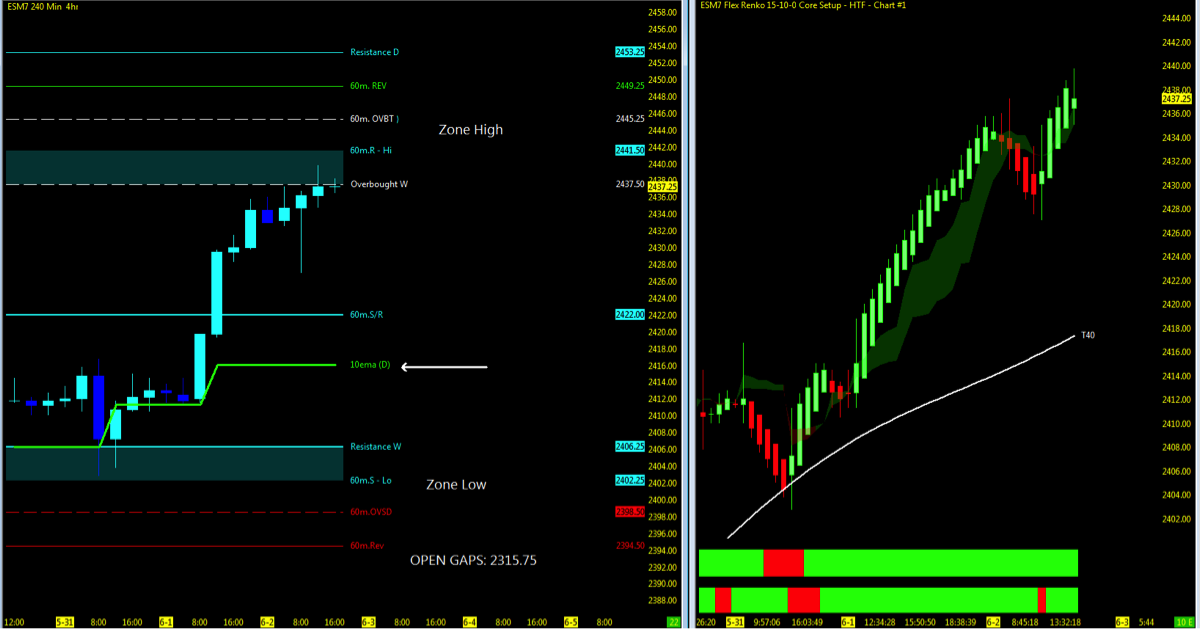
MML levels on the higher time frames, price action consolidates at the ZONE HIGH on all 3 indices to finish out week 22. Upper level resistance as price momentum on the Heikin Ashi bars maintain TREND on the range charts will look to daily and weekly MML levels. The most reliable indicator for MML levels being the 1 hour for the higher time frame, and 5 minute intraday will be reassessed daily as price action moves ahead both in price and time. Unless price is able to break above the 60m levels, a pullback to the 50% and/or 10ema for first levels of support downside will be in play. Watch for the T3 moving averages on each perspective market on the higher time range charts for support downside as well.
Key events in the market this week include Jolt’s, Apple (NASDAQ:APPL) event, contract rollover on trading platforms and UK vote on the 8th. June contract expiration nears on the indices on the 16th, Quad Witch Friday. Note: Comey to testify before senate panel.
Technical momentum probability REMAINS in a UPTREND on the bigger pic as we hold above the key moving averages with caution at the MML highs as the VIX holds under 10. Beware of the catalyst wrench (Washington Politics) that looms overhead of if and when the market may sell off in reaction to unsettling news.
Note that you can also view my market outlook on YouTube. Markets Covered: ES, YM, NQ, GC, CL, 6J, 6E
The BOTTOM LINE
Indices holding at all time highs. Downside support on change in TREND will look to the 10ema and 60m MML Zone Low. First level of support will be the 50% pullback on the week 22 uptrend. Anything lower look to the higher time frame range chart T3 moving averages. Deep pullbacks will test the 50ma. Consolidation at the highs before any breakout will see a 60m reset of the MML upside and intraday 5m range charts for short term range.
I will continue to notify readers through social media and my daily outlook; posted 30 minutes prior to the US open of any updates throughout the week.
Attempting to determine which way a market will go on any given day is merely a guess in which some will get it right and some will get it wrong. Being prepared in either direction intraday for the strongest probable trend is by plotting your longer term charts and utilizing an indicator of choice on the lower time frame to identify the setup and remaining in the trade that much longer. Any chart posted here is merely a snapshot of current technical momentum and not indicative of where price may lead forward.
NQ – Nasdaq Futures
Technical Momentum: UPTREND
Using the Murray Math Level (MML) charts on higher time frames can be a useful market internal tool as price action moves amongst fractal levels from hourly to daily charts. Confluence of levels may be levels of support/resistance or opportunities for a breakout move.
Multiple MML Overlay (4hr with 60m/Daily/Weekly and Range)
- Nearest Open Daily Gap: 5823, 5734.5, 5512.75, 5449.75
- Lowest Open Gap: 4017
ES – S&P Futures
Technical Momentum: UPTREND
Multiple MML Overlay (4hr with 60m/Daily/Weekly and Range)
- Nearest Open Daily Gap: 2315.75
- Lowest Open Gap: 1860.75
Thanks for reading and remember to always use a stop at/around key technical trend levels.
Twitter: @TradingFibz
The author trades futures intraday and may have a position in the mentioned securities at the time of publication. Any opinions expressed herein are solely those of the author, and do not in any way represent the views or opinions of any other person or entity.
: Creating Bullish Divergence?")


: Creating Bullish Divergence?")