BIG PICTURE – What’s Ahead?
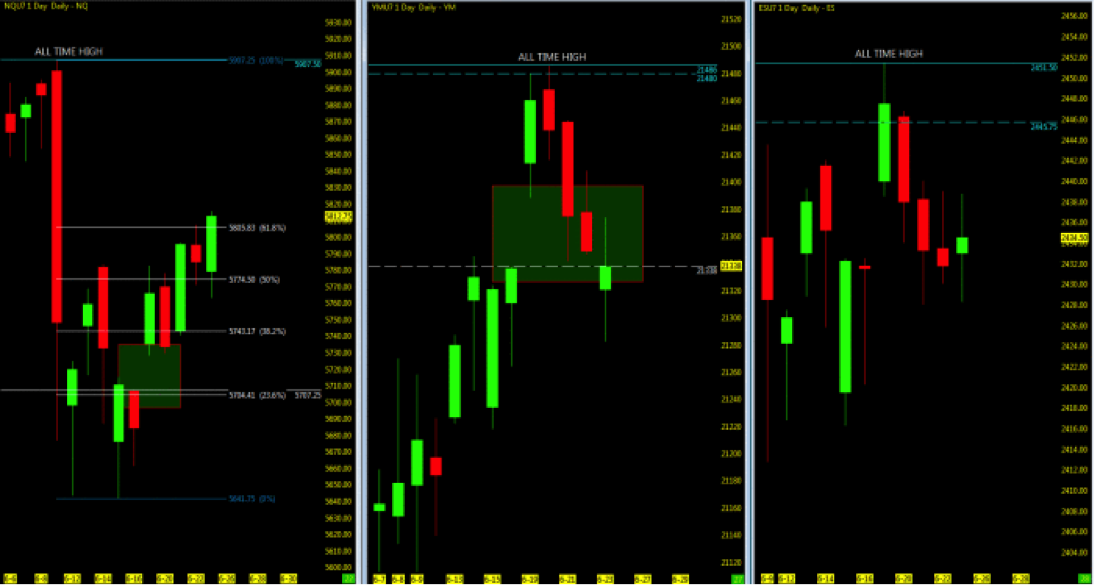
Looking across the major stock market futures indices, the Dow Jones Industrials (INDEXDJX:.DJI) and S&P 500 (INDEXSP:.INX) closed below the weekly open, while the Nasdaq (INDEXNASDAQ:.IXIC) closed above.
Open gaps closed on Dow Jones futures (YM) and S&P 500 futures (ES), while Nasdaq futures (NQ) broke back above the 61.8% fibonacci price level as it moves closer to the all time high (recap which may be found here). See chart below for a quick trend analysis snapshot.
The VIX Volatility Index is still hanging near 10 as we head into week 26 and lower volume is showing up (summer doldrums). However, Permabears are starting to increase the volume of their bearish drum beat.
FANG/FAAMG stocks remain steady and climbing back upside as the YM/ES are not seeing the deep pullback that the NQ did in Week 23. This may give the NQ an opportunity to play catch up in momentum. Overall, economic data is not as strong as we wish it to be. So we await Q2 earnings season for clarity to the big picture.
Key events in the market this week include FED speakers, GDP, non-Farm Payrolls and end of Q2.
Technical momentum probability REMAINS in an UPTREND on the bigger picture as we hold above the key moving averages. As always, BEWARE of the catalyst wrench (Washington Politics) that looms overhead if and when the market may sell off in reaction to unsettling news.
THE BOTTOM LINE
With the NQ breaking the 61.8% pullback and now holding above the 10ema, short term test will be for the index to hold above and move towards the all time highs. Any pullback will watch the 50ma and MML lower zones. Deeper pullbacks will look to the 200ma and open gaps.
ES/YM maintaining it’s momentum upside, holds in consolidation at the 10ema. Pullback to the 50ma will be the first level of support. Momentum upside look back up to the highs.
Attempting to determine which way a market will go on any given day is merely a guess in which some will get it right and some will get it wrong. Being prepared in either direction intraday for the strongest probable trend is by plotting your longer term charts and utilizing an indicator of choice on the lower time frame to identify the setup and remaining in the trade that much longer. Any chart posted here is merely a snapshot of current technical momentum and not indicative of where price may lead forward.
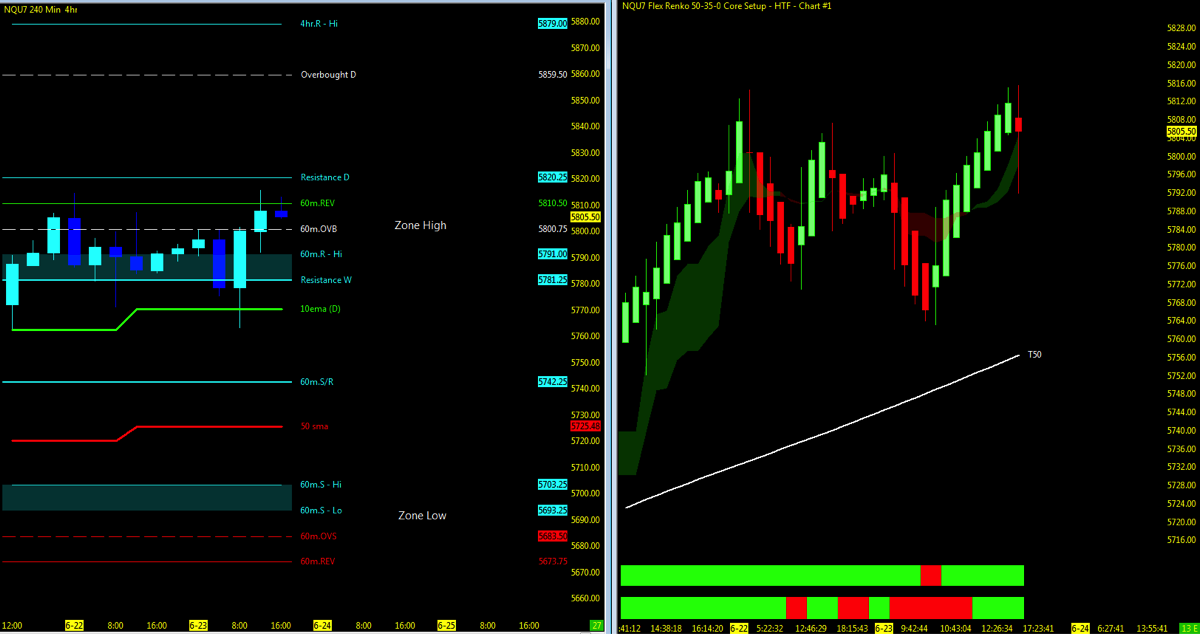
Nasdaq Futures (NQ)
Technical Momentum: UPTREND
Using the Murray Math Level (MML) charts on higher time frames can be a useful market internal tool as price action moves amongst fractal levels from hourly to daily charts. Confluence of levels may be levels of support/resistance or opportunities for a breakout move.
Multiple MML Overlay (4hr with 60m/Daily/Weekly and Range)
- Lowest Open Gap: 4017
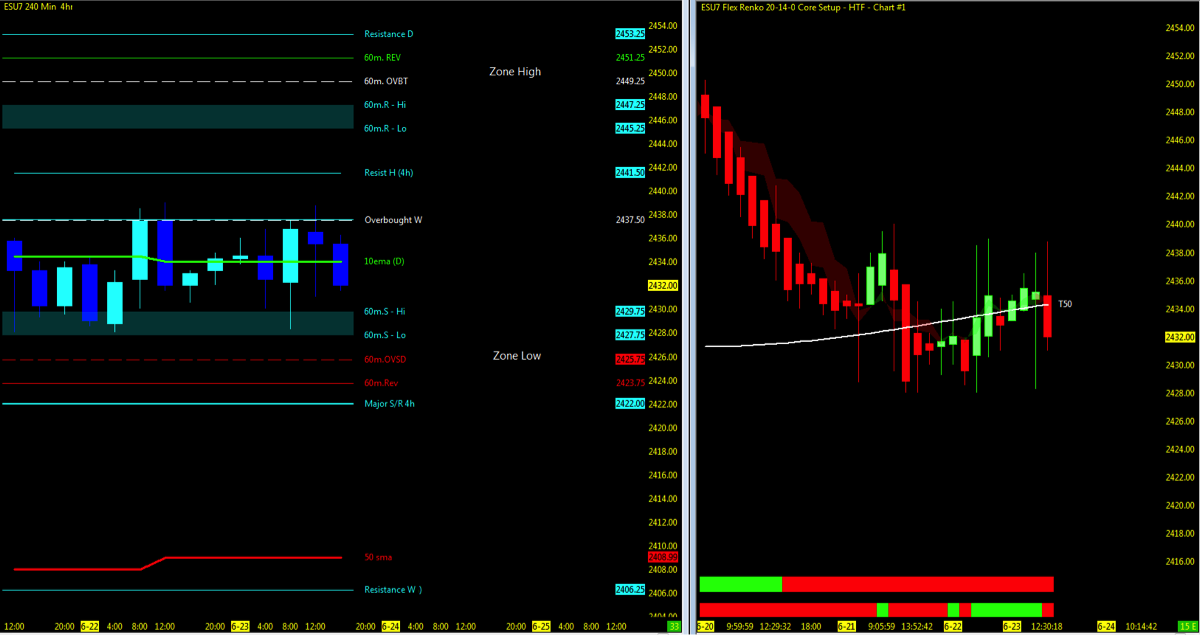
S&P 500 Futures (ES)
Technical Momentum: UPTREND CONSOLIDATION
Multiple MML Overlay (4hr with 60m/Daily/Weekly and Range)
- Lowest Open Gap: 1860.75
Thanks for reading and remember to always use a stop at/around key technical trend levels.
Twitter: @TradingFibz
The author trades futures intraday and may have a position in the mentioned securities at the time of publication. Any opinions expressed herein are solely those of the author, and do not in any way represent the views or opinions of any other person or entity.

: Creating Bullish Divergence?")

: Creating Bullish Divergence?")


