QUICK RECAP – Just when you thought…
The week 20 recap was basically a rinse, wash and repeat of week 18. Wednesday’s sell off in the market had the permabears drooling for more, but the market did what it has been relentlessly doing for 6 months now – it fought back.
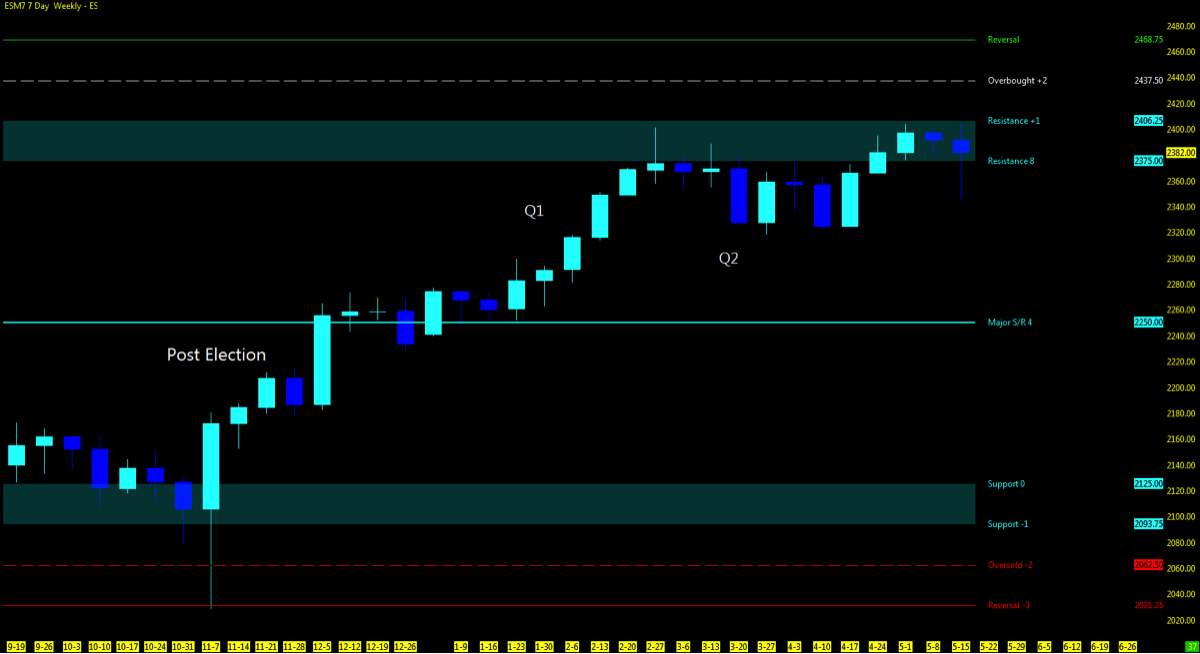
The market found its footing and not only managed to retrace 50% of the down move but entirely taking it back (plus some) to settle near the weekly open. For the week, the S&P 500 cash index (INDEXSP:.INX) was down just 0.4%, while the Nasdaq (INDEXNASDAQ:.IXIC) was down 0.6%.
See the weekly trend chart for S&P 500 futures (ES) below.
As an aside, please join me at my upcoming trading webinar for infinity futures and the live trading challenge.
The stock market indices managed to regain traction on the daily charts and hold above their respective 50 day ema’s, while nudging back above the short term 10 period moving average. This is a clear indicator of continued trend and momentum for swing traders.
THE BIG PICTURE – What’s Ahead?
The VIX Volatility Index (INDEXCBOE:VIX) closed out the week in the low 12’s after climbing into the mid 15’s right. And while the major stock market indices rallied back from the depths of a quick selloff, traders should tune into key technical indicators… and reminder to keep it simple.
It has been some time since the market has fluctuated around the key moving averages that I observe and now has become an integral part of the upside momentum and/or potential for a short selling opportunity. Observing and keeping these averages in mind as I do, may keep you on the right side of the trade.
- 10 day ma: Watch for price action to hold above for short term trend
- 50 day ma: As long as price action finds support at this level and holds above; trend remains in an uptrend. Any move downside and the 50ma becomes resistance. look for price to continue its move further to the short.
- 200ma: Indices well above the institutional support and of no concern yet at this time.
If price momentum holds above the 3 key moving averages, using the Murray Math Levels (MML) zone high would be the first levels of resistance that I would look for a potential stall out in the market. While the S&P 500 futures (ES) and Nasdaq futures (NQ) sit at the major support resistance off the lows, the higher probability remains to the upside. If momentum is unable to hold at the 10 day ma, watch for the 50 day ma to become support in the MML zone low. Any further selling below the 50ma, open gaps will be in play, including the 4hr and daily MML levels downside.
Key events in the market this week include multiple fed speakers and the FOMC minutes. On Wednesday, the politics of Comey testifying will test (again) the market’s reaction. As the end of the week approaches, we may see diminished volume as traders look to the upcoming holiday weekend.
Technical momentum probability REMAINS in a UPTREND on the bigger pic. Signs of market strength continue as the indices rebounded off the drawdown of midweek 20. Beware of the catalyst wrench that looms overhead of if and when the market will sell off even further.
Note that you can also view my market outlook on YouTube. Markets Covered: ES, YM, NQ, GC, CL
Attempting to determine which way a market will go on any given day is merely a guess in which some will get it right and some will get it wrong. Being prepared in either direction intraday for the strongest probable trend is by plotting your longer term charts and utilizing an indicator of choice on the lower time frame to identify the setup and remaining in the trade that much longer. Any chart posted here is merely a snapshot of current technical momentum and not indicative of where price may lead forward.
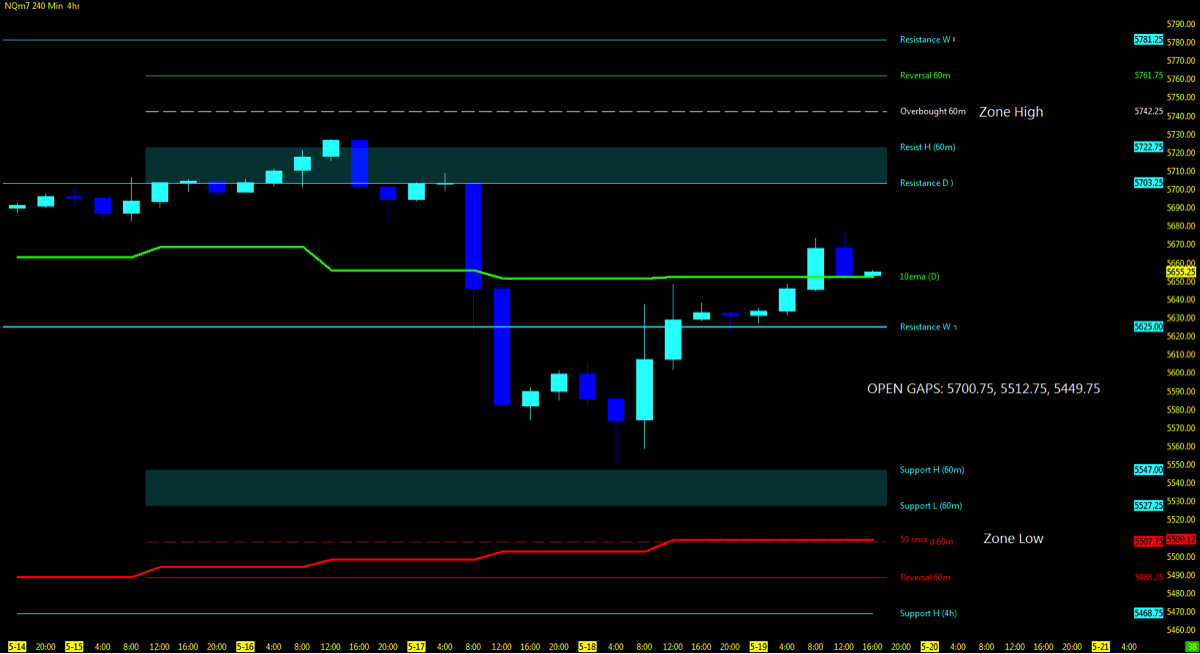
NASDAQ FUTURES – (NQ)
Technical Momentum: UPTREND
Using the Murray Math Level (MML) charts on higher time frames can be a useful market internal tool as price action moves amongst fractal levels from hourly to daily charts. Confluence of levels may be levels of support/resistance or opportunities for a breakout move.
- Multiple MML Overlay (4hr with 60m/Daily/Weekly)
- Lowest Open Gap: 4017
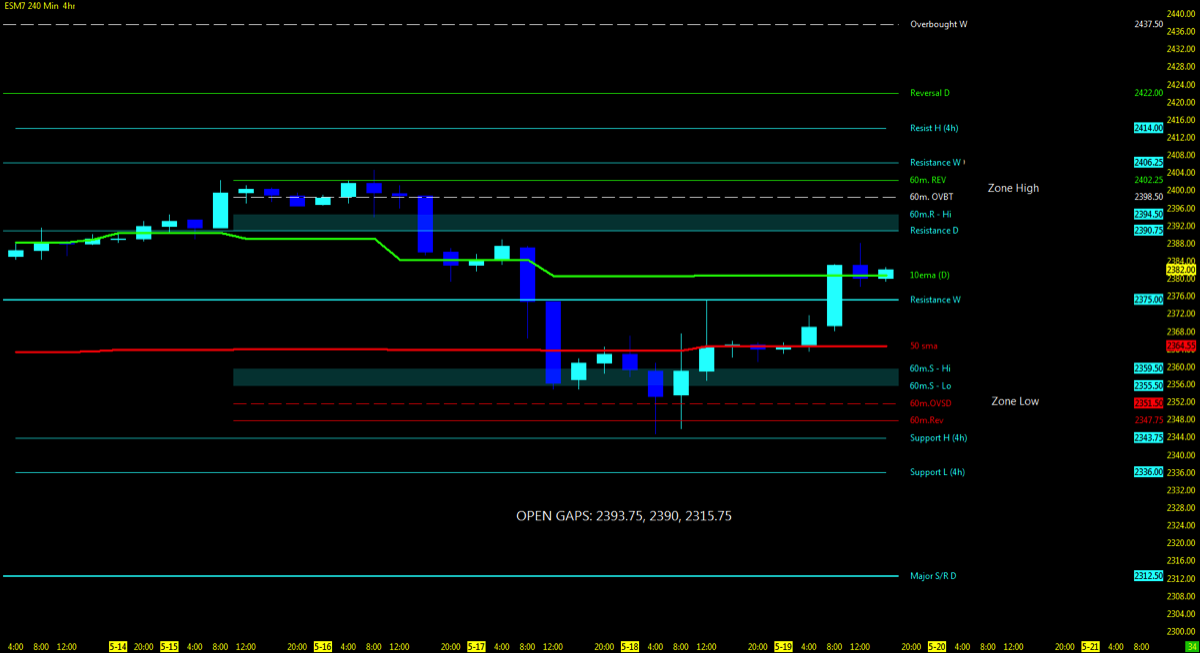
S&P FUTURES – (ES)
Technical Momentum: UPTREND
- Multiple MML Overlay (4hr with 60m/Daily/Weekly)
- Lowest Open Gap: 1860.75
Thanks for reading and remember to always use a stop at/around key technical trend levels.
Twitter: @TradingFibz
The author trades futures intraday and may have a position in the mentioned securities at the time of publication. Any opinions expressed herein are solely those of the author, and do not in any way represent the views or opinions of any other person or entity.

: Showing Some Signs of Emerging Strength")
