THE BIG PICTURE – What Lies Ahead?
Recapping last week, the Dow Jones and S&P 500 (INDEXSP:.INX) held and closed above the weekly open while the Nasdaq (INDEXNASDAQ:.IXIC) pulled back to close out two daily open gaps and is in the zone of the 50ma.
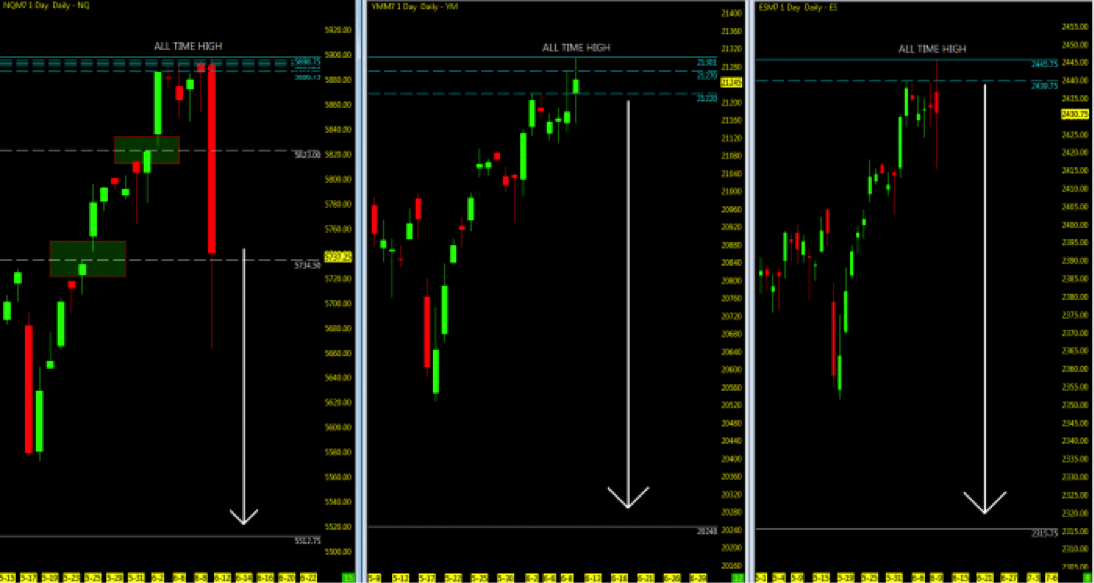
All 3 major stock market indices made new all time highs in week 23, maintaining their unprecedented and relentless uptrend. Each index still holds above mid-term 50 period moving averages (recap which may be found here).
VIX levels are maintaining in the 9 -10’s as we head into week 24. There appears to be a big picture of complacency as the Nasdaq selloff barely affected the other indices. Volume will now shift to the September contract as we approach June contract expiration. FANG stocks hitting all time highs and the AMZN/GOOGL pair breaking the 1K mark only to finish downside on Friday will look to regain some traction and what some may consider a sale price. Permabears may come out to play if any additional selling plays out as Jim Rogers in his Friday post already laying out the Doom & Gloom ahead. Keep your eyes on Brazil, UK and FOMC to move the markets in either direction.
With the open gaps now closed out on the NQ and the nearest ones below will sure send the market into a tizzy. The focus will be if the indices can hold or regain (NQ) it’s momentum above the 10ema and reach new upper highs. Since no upper levels beyond the all time highs to refer to and retest, technical upper levels are left to the projections of studies that forecast out percentages. Be it Fibonacci projections, daily upper resistance levels or Murray Math Levels to name a few that can be levels to watch upside.
Crude oil is struggling to regain momentum back above the key moving averages and with two open gaps below, is finding a consolidation base at the MML Zone Low. Watch for a retest upside tot he 50ma or maintain momentum down to close out the gaps down to 43,81. Bigger pic momentum remains down.
Gold is also struggling to regain the highs of 2016, and is vacillating between the Daily MML zones. It barely held above the 50ma before retesting and bouncing back up. Look for the retest once again as price action draws to MML Zone Low and the 50ema. Bigger pic momentum remains upside yet in consolidation.
Key events in the market this week include FOMC meeting and Quad Witching. June contract expiration on the 16th,
Technical momentum probability REMAINS in a UPTREND on the bigger picture as we hold above the key moving averages. Beware of the catalyst wrench (Washington Politics) that looms overhead of if and when the market may sell off in reaction to unsettling news.
Note that you can also view my market outlook on YouTube. Markets Covered: ES, YM, NQ, GC, CL, 6J, 6E
Attempting to determine which way a market will go on any given day is merely a guess in which some will get it right and some will get it wrong. Being prepared in either direction intraday for the strongest probable trend is by plotting your longer term charts and utilizing an indicator of choice on the lower time frame to identify the setup and remaining in the trade that much longer. Any chart posted here is merely a snapshot of current technical momentum and not indicative of where price may lead forward.
THE BOTTOM LINE
With contract rollover approaching and indices (YM/ES) holding at all time highs, watch for the follow through of Friday’s price action to set the tone at the start of the week.
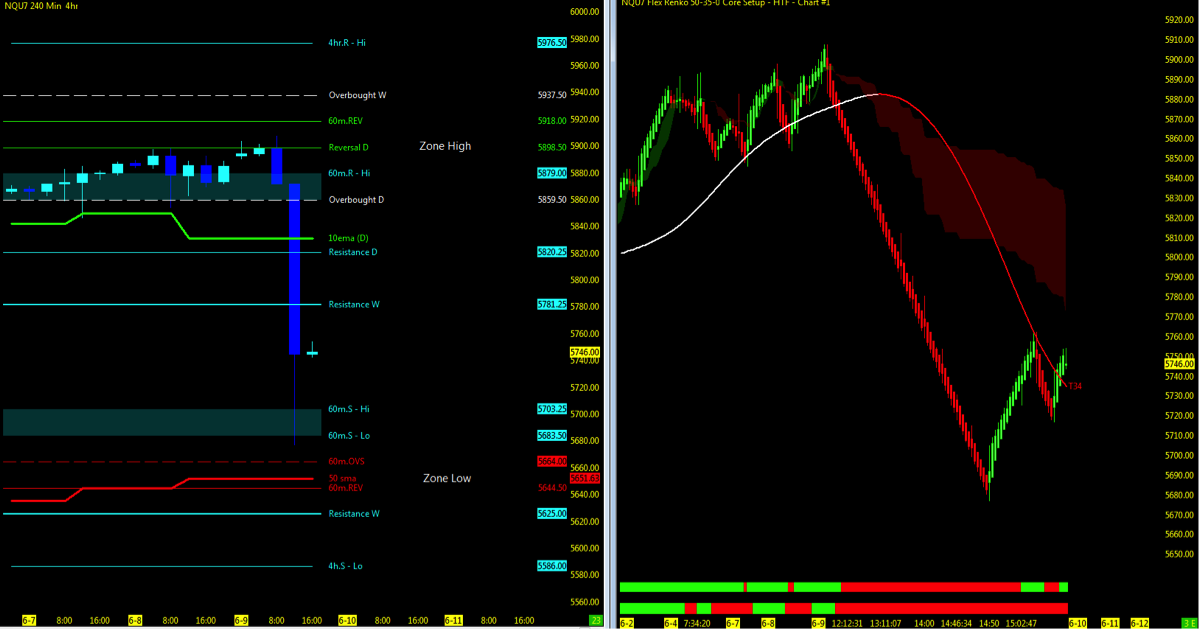
Look for Nasdaq futures (NQ) to test support at 50ma downside (50% Daily MML). An 80 point move to regain traction above the 10ema will be a challenge for the NQ as the short term higher time frame momentum has shifted to the downtrend. Deeper pullbacks will look for Daily MML, 200ma and open gaps.
Nasdaq Futures (NQ)
Technical Momentum: UPTREND PULLBACK
Using the Murray Math Level (MML) charts on higher time frames can be a useful market internal tool as price action moves amongst fractal levels from hourly to daily charts. Confluence of levels may be levels of support/resistance or opportunities for a breakout move.
Multiple MML Overlay (4hr with 60m/Daily/Weekly and Range)
- Lowest Open Gap: 4017
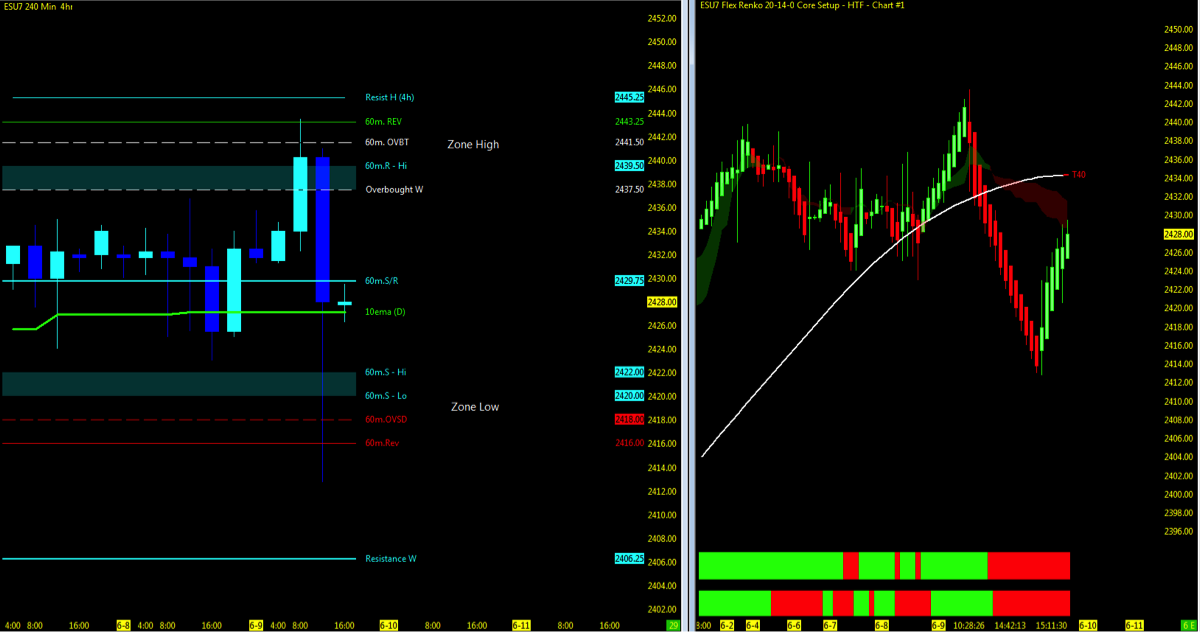
S&P 500 Futures (ES)
Technical Momentum: UPTREND
Multiple MML Overlay (4hr with 60m/Daily/Weekly and Range)
- Lowest Open Gap: 1860.75
Thanks for reading and remember to always use a stop at/around key technical trend levels.
Twitter: @TradingFibz
The author trades futures intraday and may have a position in the mentioned securities at the time of publication. Any opinions expressed herein are solely those of the author, and do not in any way represent the views or opinions of any other person or entity.


