The Dow Jones Industrials continue to perform well with large cap stocks leading the way in Week 31 and into Week 32. Earnings season has gone well thus far but bulls are hoping this spills over into the S&P 500 (INDEXSP:.INX) and Nasdaq (INDEXNASDAQ:.IXIC).
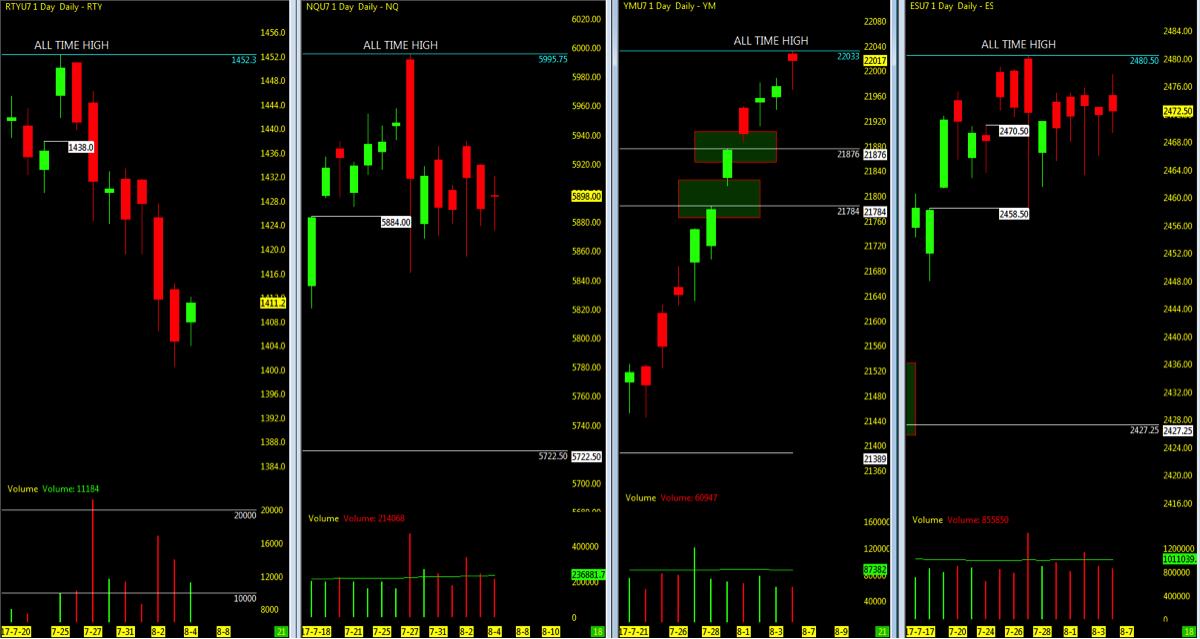
To sum in it: The Dow Industrials are pushing higher, the S&P 500 futures (ES) / Nasdaq futures (NQ) remain in consolidation, while the small caps pull up the rear after another rough week.
The ES daily candle chart is walking the 10 day ema tightrope yet maintaining momentum upside near all time highs. The ES weekly is once again in consolidation after 2 months of sideways price action at the MML highs. The NQ has been in consolidation for three weeks now and unable to break above the MMl 5937.50. On both charts, we’ve seen two weeks of Heikin Ashi indecision/doji bars and this calls for patience while we wait for the next breakout or pullback.
THE BIG PICTURE: Dow Industrials Lead The Way, But Watch Tech
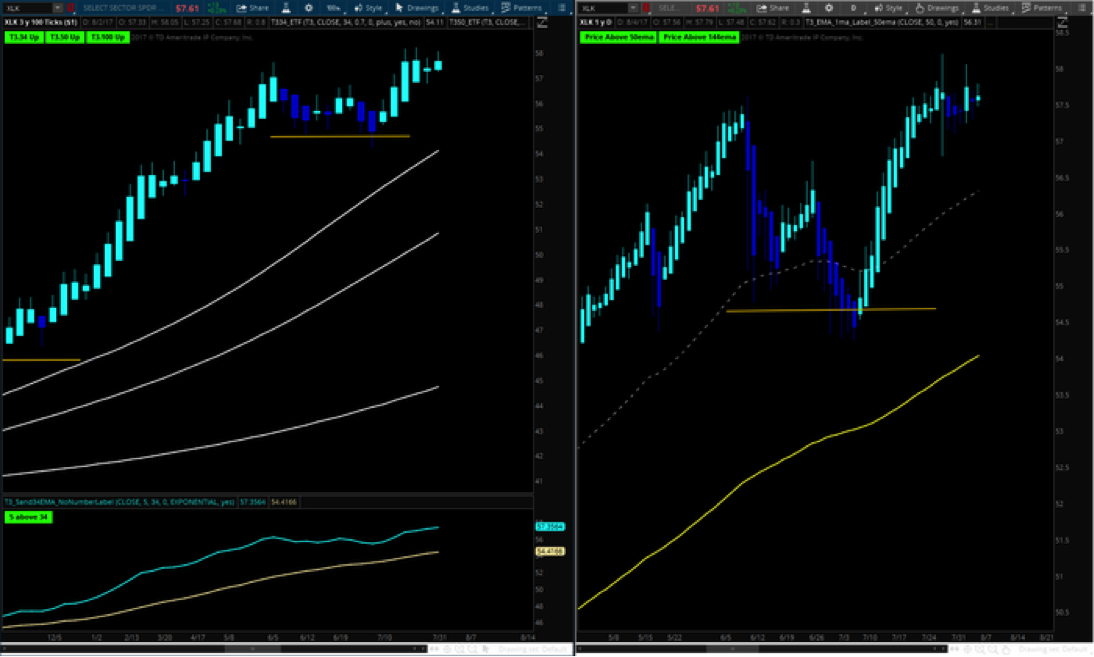
Now that all FANG/FAAMG econ numbers are out, the follow through may be just enough to hold at the highs and the catalyst the market was looking for to push the NQ/Tech industry and ETF (XLK) to hold upside.
Transports have taken a hit since mid-July but may have found support near the daily 144 which has been in uptrend for some time. Overall the Vanguard stock market index (VTI) is still holding strong after a small pullback to the 34ema and moving back upside.
With just one more month of summertime trading left and the prospect of another rate hike in September, the action may begin to pick up. Keep this in mind in the weeks ahead. It’s also worth noting that the markets don’t care about the Washington antics. It looks at numbers. No reason to be trading based on political views – let your bias go and stay focused on your approach and process. As always be ready for both directions in the unpredictable market.
Key events in the market this week are earnings (DIS, NVDA, SNAP, APRN, CLN) Jolt’s and Fed Speakers.
Technical momentum probability REMAINS in a UPTREND on the bigger picture as we hold above key moving averages. As always, BEWARE of the catalyst wrench (Washington Politics) that looms overhead of if and when the market may sell off in reaction to unsettling news.
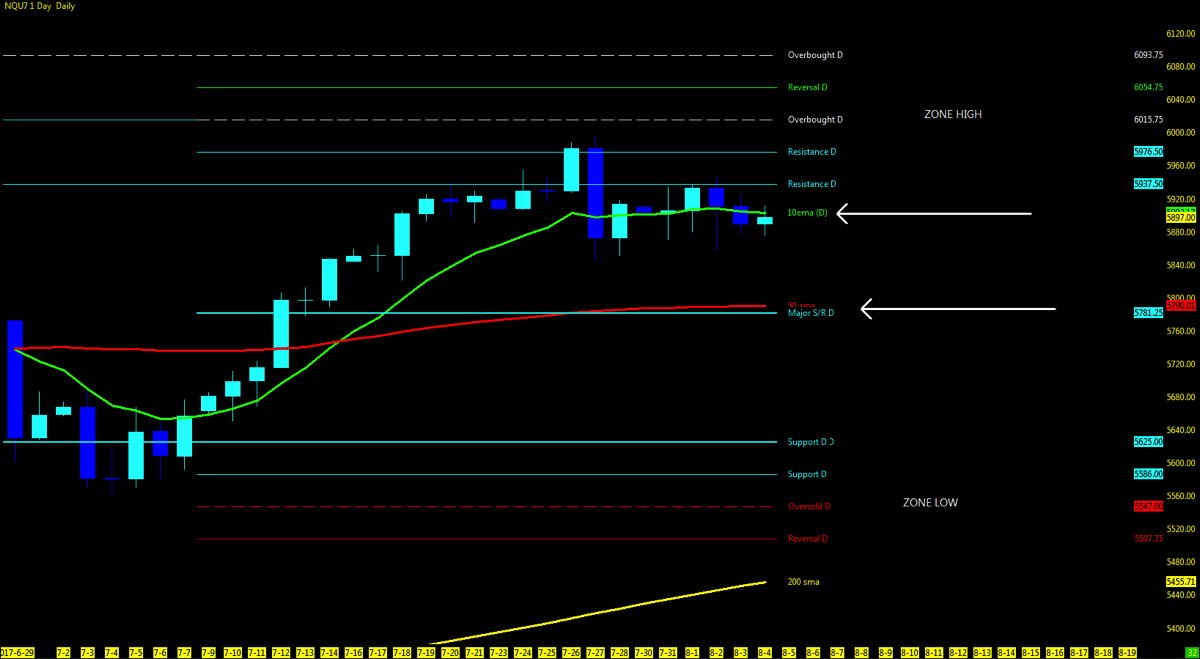
NQ – Nasdaq Futures
Technical Momentum: UPTREND
Using the Murray Math Level (MML) charts on higher time frames can be a useful market internal tool as price action moves amongst fractal levels from hourly to daily charts. Confluence of levels may be levels of support/resistance or opportunities for a breakout move.
Multiple MML Overlay (DAILY )
- Lowest Open Gap: 4017
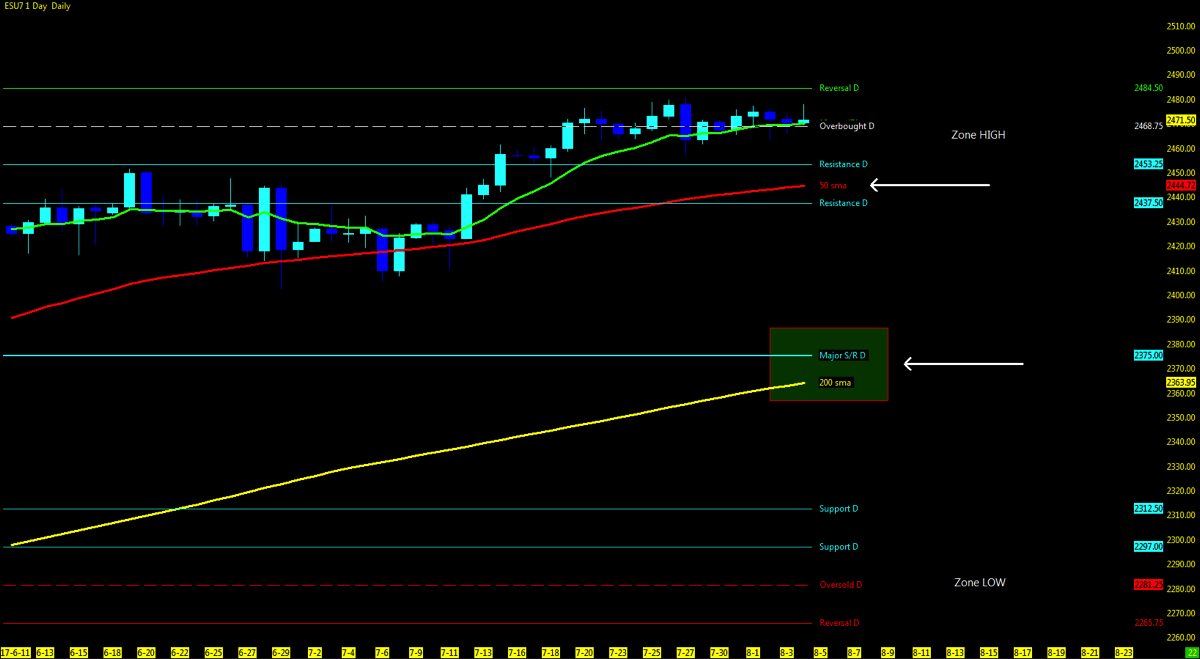
ES – S&P Futures
Technical Momentum: UPTREND
Multiple MML Overlay (DAILY )
- Lowest Open Gap: 1860.75
Thanks for reading and remember to always use a stop at/around key technical trend levels.
Twitter: @TradingFibz
The author trades futures intraday and may have a position in the mentioned securities at the time of publication. Any opinions expressed herein are solely those of the author, and do not in any way represent the views or opinions of any other person or entity.

: Creating Bullish Divergence?")

: Creating Bullish Divergence?")


