The Solar Sector ETF (TAN) has begun to show up on investment radars once more.
Just weeks ago, solar stocks were left for dead. But a 5-week rally has brought them back to an important technical crossroads.
Although it is far from bullish, call it neutral, the Solar ETF (TAN) has turned its shorter-term moving average back up and is testing its longer-term moving average. Yet relative strength is still a bit weak. Time to check the charts for guideposts.
Note that the following MarketSmith charts are built with Investors Business Daily’s product suite.
I am an Investors Business Daily (IBD) partner and promote the use of their products. The entire platform offers a good mix of analysts, education, and technical and fundamental data.
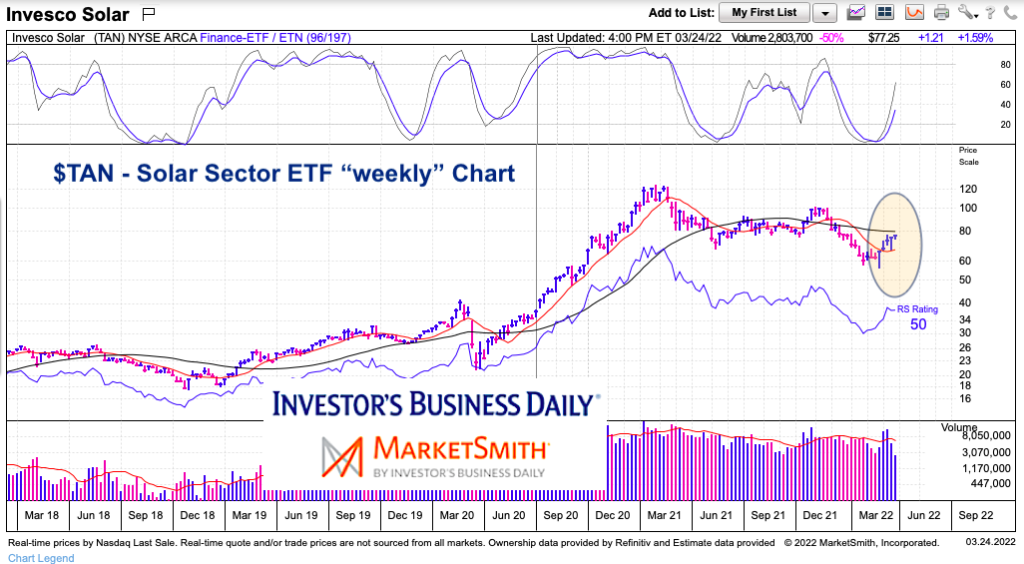
$TAN Solar Sector ETF “weekly” Chart
The intermediate-term chart shows the sharp rally higher (out of COVID crash), followed by the long drawn out one year downtrend. Interesting insight: from the lowest weekly close (22.74) to the highest weekly close (121.64) you get a rally of 98.90. Then the drop to the lowest weekly close of this pullback (60.51) gives you a decline of 61.13. That is 61.8% (for Fibonacci lovers).
So, could this mark an important low? Momentum is still rising while relative strength is middling. We need to see more. Importantly, TAN would need to climb above the 40-week moving average and hold. That’s a tall order but one bulls need to see.
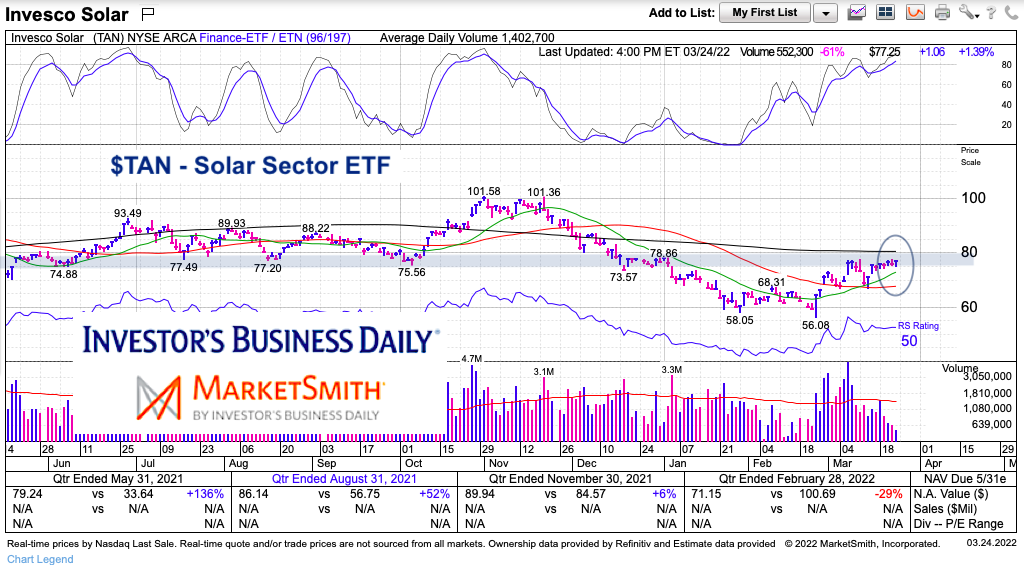
$TAN Solar Sector ETF “daily” Chart
On the shorter-term chart, we can see a similar development. The 50-day moving average has flattened and the 20-day moving average is rising. But price is coming into a key resistance area and hovering just below the 200-day moving average. A nice base has formed, but once again, we need to see price rise above its longer-term moving average (around $80) to get excited.
Twitter: @andrewnyquist
The author may have a position in mentioned securities at the time of publication. Any opinions expressed herein are solely those of the author, and do not in any way represent the views or opinions of any other person or entity.

")


